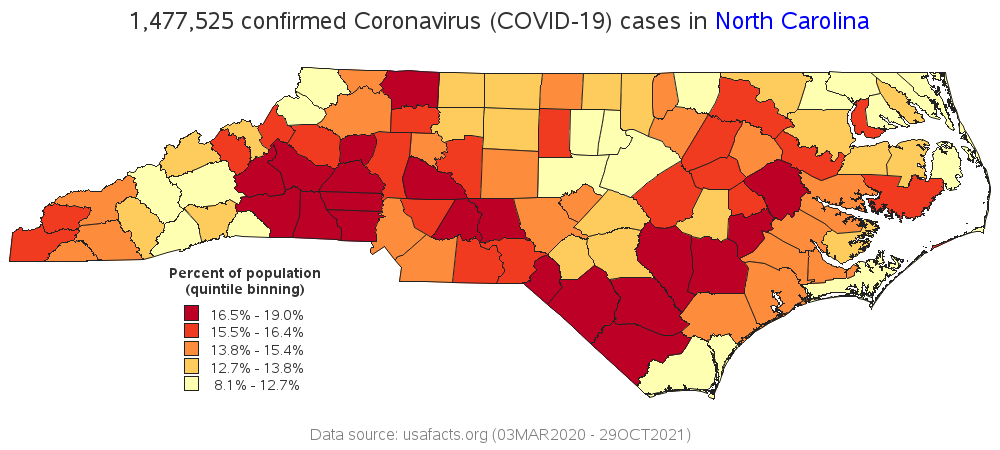
| 1,477,525 confirmed Coronavirus (COVID-19) cases in North Carolina |
| Obs | County | Coronavirus cases | Population (2018) | Cases per 100,000 population |
Percent of population with Coronavirus |
|---|---|---|---|---|---|
| 1 | Mecklenburg County | 157,260 | 1,093,901 | 14,376 | 14.4% |
| 2 | Wake County | 129,210 | 1,092,305 | 11,829 | 11.8% |
| 3 | Guilford County | 67,913 | 533,670 | 12,726 | 12.7% |
| 4 | Forsyth County | 51,785 | 379,099 | 13,660 | 13.7% |
| 5 | Cumberland County | 45,623 | 332,330 | 13,728 | 13.7% |
| 6 | Gaston County | 40,027 | 222,846 | 17,962 | 18.0% |
| 7 | Union County | 36,383 | 235,908 | 15,423 | 15.4% |
| 8 | Durham County | 34,630 | 316,739 | 10,933 | 10.9% |
| 9 | Cabarrus County | 32,853 | 211,342 | 15,545 | 15.5% |
| 10 | Johnston County | 32,416 | 202,675 | 15,994 | 16.0% |
| 11 | Pitt County | 29,706 | 179,914 | 16,511 | 16.5% |
| 12 | Onslow County | 29,587 | 197,683 | 14,967 | 15.0% |
| 13 | Iredell County | 28,885 | 178,435 | 16,188 | 16.2% |
| 14 | New Hanover County | 28,699 | 232,274 | 12,356 | 12.4% |
| 15 | Catawba County | 28,347 | 158,652 | 17,867 | 17.9% |
| 16 | Buncombe County | 28,191 | 259,103 | 10,880 | 10.9% |
| 17 | Alamance County | 26,393 | 166,436 | 15,858 | 15.9% |
| 18 | Rowan County | 26,221 | 141,262 | 18,562 | 18.6% |
| 19 | Davidson County | 25,786 | 166,614 | 15,476 | 15.5% |
| 20 | Robeson County | 24,992 | 131,831 | 18,958 | 19.0% |
| 21 | Randolph County | 21,865 | 143,351 | 15,253 | 15.3% |
| 22 | Harnett County | 18,470 | 134,214 | 13,762 | 13.8% |
| 23 | Cleveland County | 18,367 | 97,645 | 18,810 | 18.8% |
| 24 | Wayne County | 16,447 | 123,248 | 13,345 | 13.3% |
| 25 | Brunswick County | 16,298 | 136,744 | 11,919 | 11.9% |
| 26 | Burke County | 15,745 | 90,382 | 17,421 | 17.4% |
| 27 | Nash County | 15,256 | 94,016 | 16,227 | 16.2% |
| 28 | Henderson County | 15,230 | 116,748 | 13,045 | 13.0% |
| 29 | Lincoln County | 14,999 | 83,770 | 17,905 | 17.9% |
| 30 | Craven County | 14,286 | 102,912 | 13,882 | 13.9% |
| 31 | Moore County | 13,666 | 98,682 | 13,849 | 13.8% |
| 32 | Caldwell County | 13,418 | 82,029 | 16,358 | 16.4% |
| 33 | Wilson County | 13,237 | 81,455 | 16,251 | 16.3% |
| 34 | Surry County | 12,425 | 71,948 | 17,269 | 17.3% |
| 35 | Rockingham County | 12,184 | 90,690 | 13,435 | 13.4% |
| 36 | Orange County | 11,838 | 146,027 | 8,107 | 8.1% |
| 37 | Stanly County | 11,652 | 62,075 | 18,771 | 18.8% |
| 38 | Rutherford County | 11,433 | 66,826 | 17,109 | 17.1% |
| 39 | Sampson County | 11,296 | 63,626 | 17,754 | 17.8% |
| 40 | Wilkes County | 10,570 | 68,557 | 15,418 | 15.4% |
| 41 | Columbus County | 10,086 | 55,655 | 18,122 | 18.1% |
| 42 | Duplin County | 9,972 | 58,856 | 16,943 | 16.9% |
| 43 | Franklin County | 9,907 | 67,560 | 14,664 | 14.7% |
| 44 | Lenoir County | 9,483 | 55,976 | 16,941 | 16.9% |
| 45 | Lee County | 9,434 | 61,452 | 15,352 | 15.4% |
| 46 | Pender County | 8,805 | 62,162 | 14,165 | 14.2% |
| 47 | McDowell County | 8,647 | 45,507 | 19,001 | 19.0% |
| 48 | Carteret County | 8,377 | 69,524 | 12,049 | 12.0% |
| 49 | Granville County | 7,952 | 60,115 | 13,228 | 13.2% |
| 50 | Edgecombe County | 7,949 | 52,005 | 15,285 | 15.3% |
| 51 | Halifax County | 7,918 | 50,574 | 15,656 | 15.7% |
| 52 | Haywood County | 7,464 | 61,971 | 12,044 | 12.0% |
| 53 | Beaufort County | 7,179 | 47,079 | 15,249 | 15.2% |
| 54 | Hoke County | 7,143 | 54,764 | 13,043 | 13.0% |
| 55 | Richmond County | 7,125 | 44,887 | 15,873 | 15.9% |
| 56 | Vance County | 6,838 | 44,582 | 15,338 | 15.3% |
| 57 | Chatham County | 6,771 | 73,139 | 9,258 | 9.3% |
| 58 | Watauga County | 6,636 | 55,945 | 11,862 | 11.9% |
| 59 | Alexander County | 6,469 | 37,353 | 17,319 | 17.3% |
| 60 | Davie County | 6,435 | 42,733 | 15,059 | 15.1% |
| 61 | Stokes County | 6,257 | 45,467 | 13,762 | 13.8% |
| 62 | Yadkin County | 6,005 | 37,543 | 15,995 | 16.0% |
| 63 | Scotland County | 5,735 | 34,810 | 16,475 | 16.5% |
| 64 | Jackson County | 5,652 | 43,327 | 13,045 | 13.0% |
| 65 | Bladen County | 5,476 | 33,190 | 16,499 | 16.5% |
| 66 | Pasquotank County | 5,249 | 39,639 | 13,242 | 13.2% |
| 67 | Person County | 5,105 | 39,507 | 12,922 | 12.9% |
| 68 | Macon County | 4,970 | 35,285 | 14,085 | 14.1% |
| 69 | Cherokee County | 4,643 | 28,383 | 16,358 | 16.4% |
| 70 | Montgomery County | 4,542 | 27,271 | 16,655 | 16.7% |
| 71 | Transylvania County | 3,888 | 34,215 | 11,363 | 11.4% |
| 72 | Anson County | 3,856 | 24,877 | 15,500 | 15.5% |
| 73 | Dare County | 3,850 | 36,501 | 10,548 | 10.5% |
| 74 | Martin County | 3,651 | 22,671 | 16,104 | 16.1% |
| 75 | Ashe County | 3,443 | 27,109 | 12,701 | 12.7% |
| 76 | Greene County | 3,318 | 21,012 | 15,791 | 15.8% |
| 77 | Caswell County | 3,195 | 22,698 | 14,076 | 14.1% |
| 78 | Hertford County | 2,856 | 23,659 | 12,072 | 12.1% |
| 79 | Yancey County | 2,823 | 17,903 | 15,768 | 15.8% |
| 80 | Madison County | 2,781 | 21,763 | 12,779 | 12.8% |
| 81 | Currituck County | 2,750 | 27,072 | 10,158 | 10.2% |
| 82 | Avery County | 2,735 | 17,505 | 15,624 | 15.6% |
| 83 | Northampton County | 2,599 | 19,676 | 13,209 | 13.2% |
| 84 | Bertie County | 2,475 | 19,026 | 13,009 | 13.0% |
| 85 | Warren County | 2,388 | 19,807 | 12,056 | 12.1% |
| 86 | Polk County | 2,335 | 20,611 | 11,329 | 11.3% |
| 87 | Chowan County | 2,297 | 14,029 | 16,373 | 16.4% |
| 88 | Mitchell County | 2,057 | 15,000 | 13,713 | 13.7% |
| 89 | Swain County | 1,972 | 14,245 | 13,843 | 13.8% |
| 90 | Pamlico County | 1,719 | 12,670 | 13,567 | 13.6% |
| 91 | Clay County | 1,656 | 11,139 | 14,867 | 14.9% |
| 92 | Alleghany County | 1,614 | 11,161 | 14,461 | 14.5% |
| 93 | Washington County | 1,593 | 11,859 | 13,433 | 13.4% |
| 94 | Perquimans County | 1,558 | 13,422 | 11,608 | 11.6% |
| 95 | Jones County | 1,351 | 9,637 | 14,019 | 14.0% |
| 96 | Graham County | 1,330 | 8,484 | 15,677 | 15.7% |
| 97 | Camden County | 1,145 | 10,710 | 10,691 | 10.7% |
| 98 | Gates County | 1,088 | 11,573 | 9,401 | 9.4% |
| 99 | Hyde County | 826 | 5,230 | 15,793 | 15.8% |
| 100 | Tyrrell County | 552 | 4,131 | 13,362 | 13.4% |
| 101 | Statewide Unallocated | 11 | . | . | . |
| 1,477,525 | 10,383,620 |
| Data source: usafacts.org (03MAR2020 - 29OCT2021) |