Robert Allison's SAS/Graph Samples #18
Click on thumbnail to see full-size chart.
Click on label to see descriptions and SAS code.
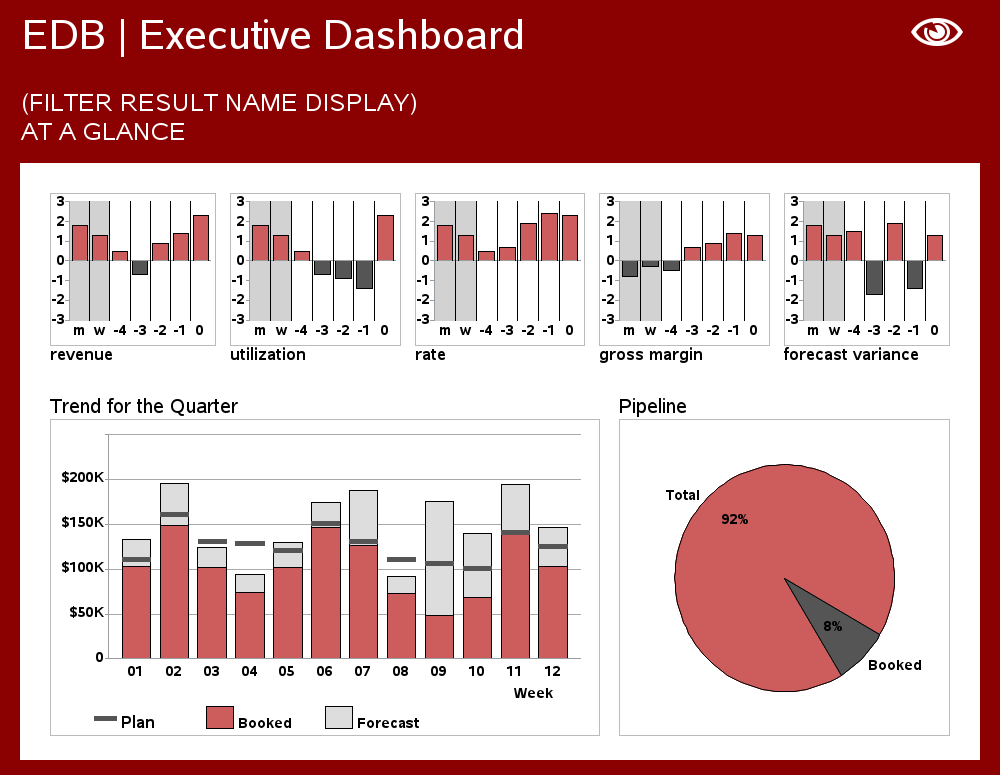
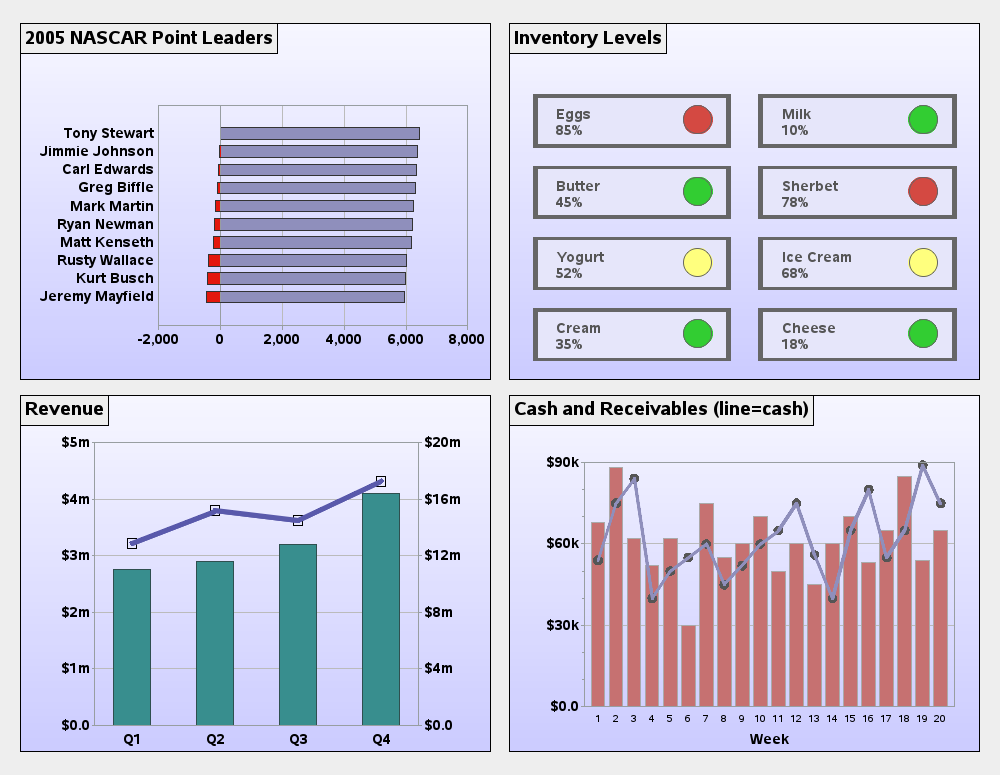
Executive Dashboard
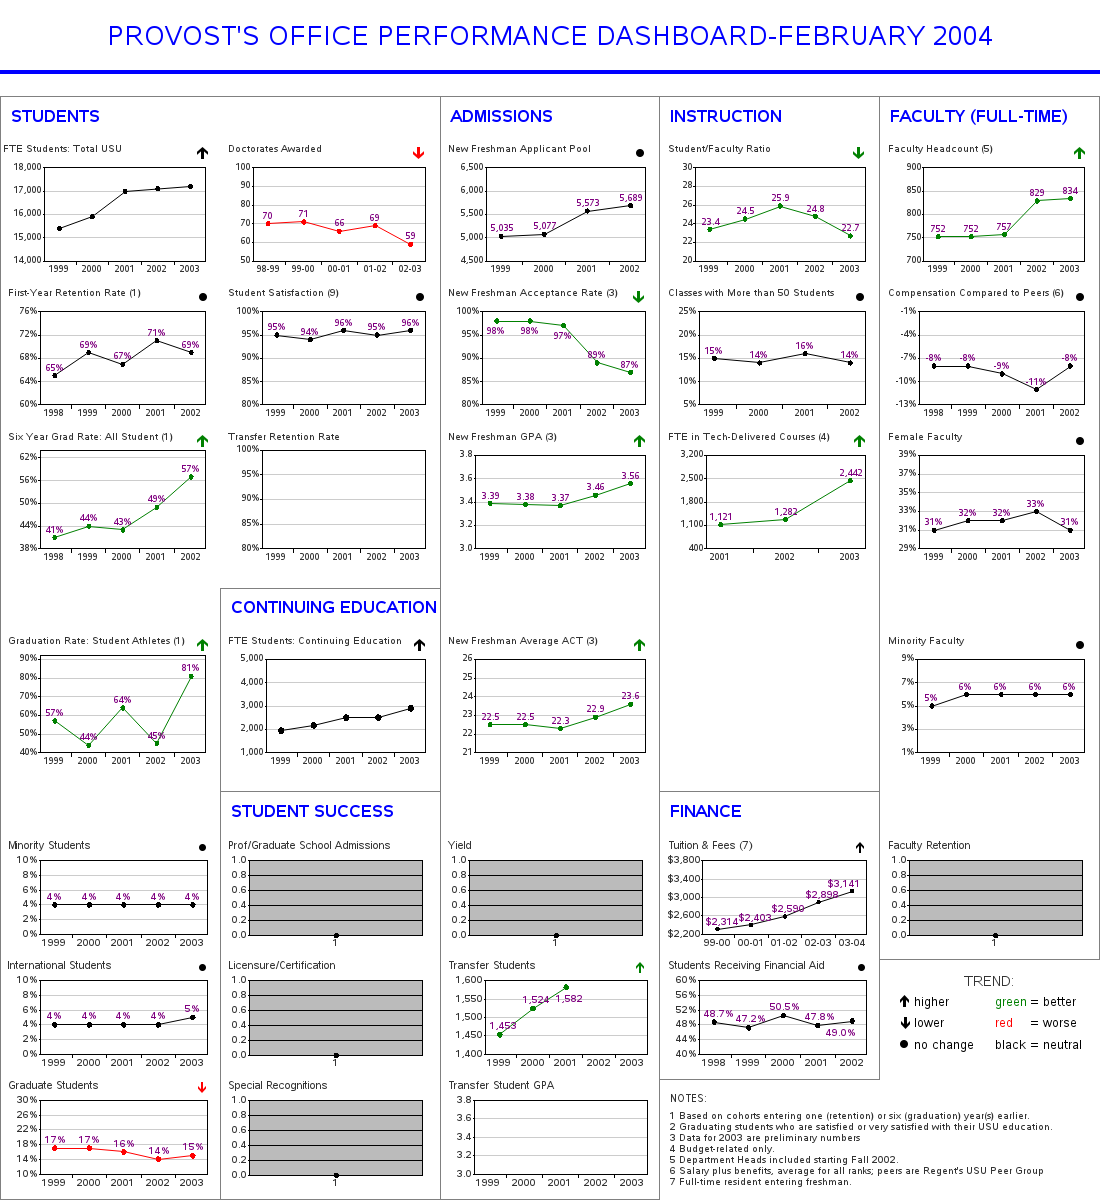
School Perf. Dashboard
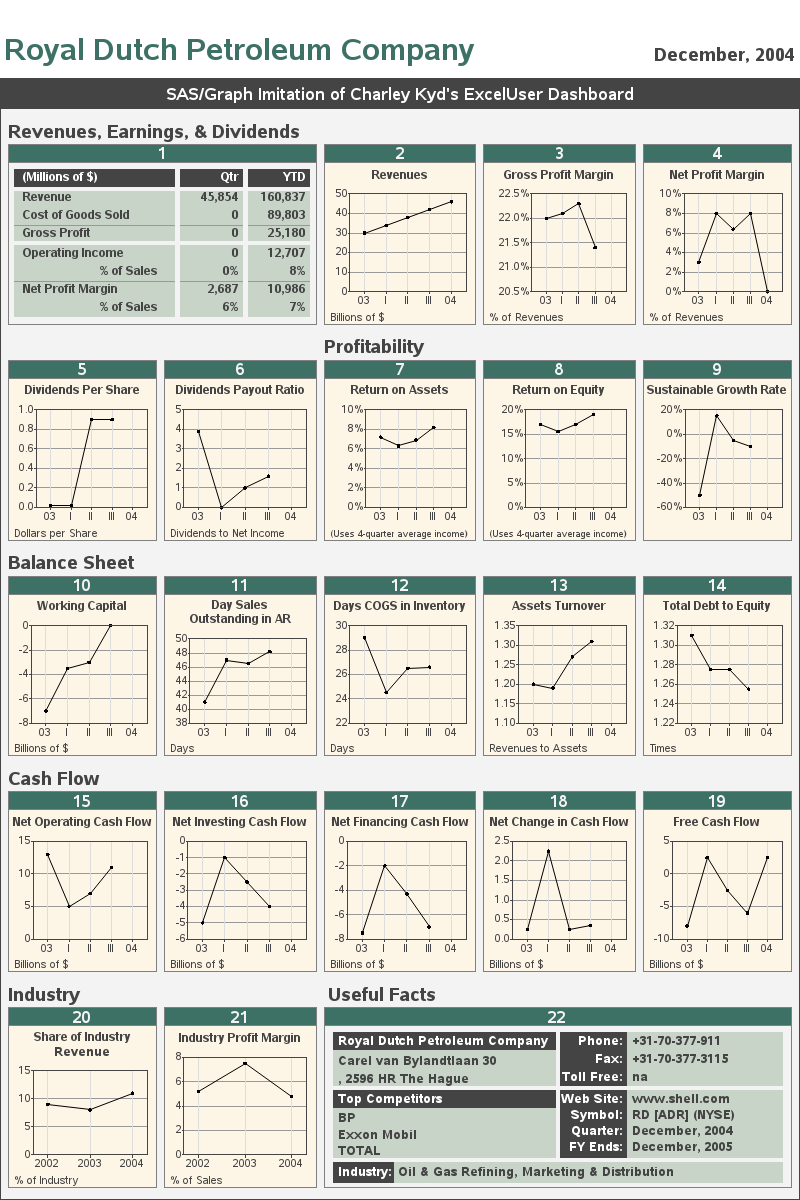
Shell Oil Dashboard
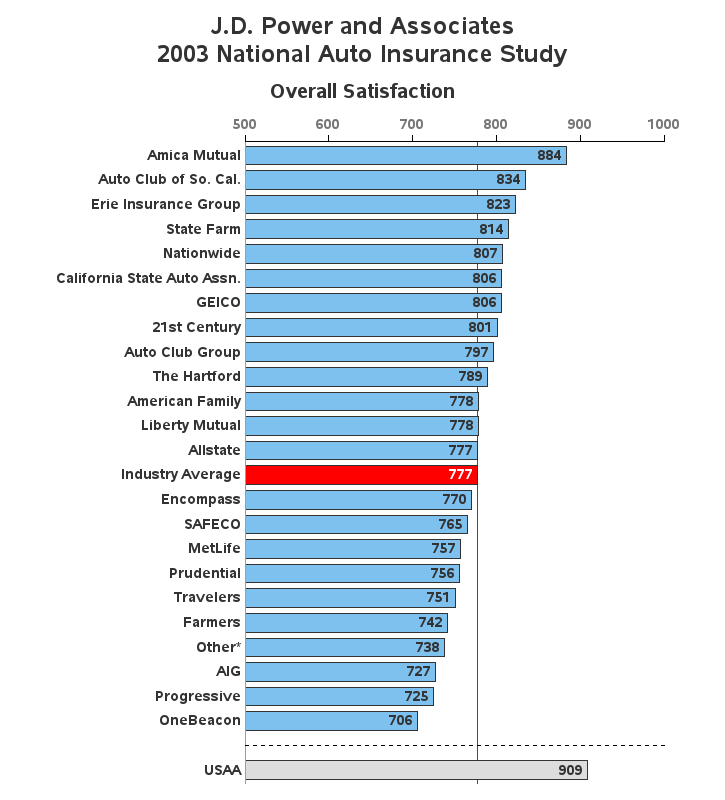
J. D. Power
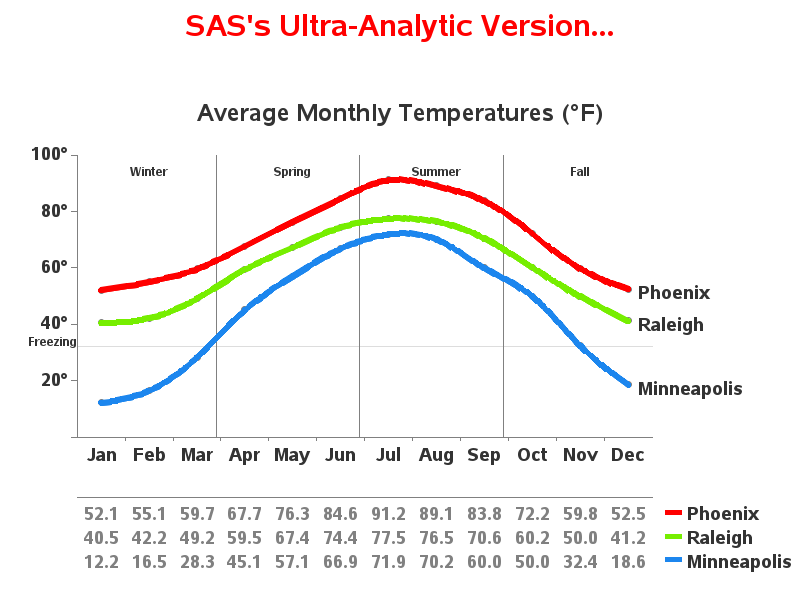
Temperature Analysis
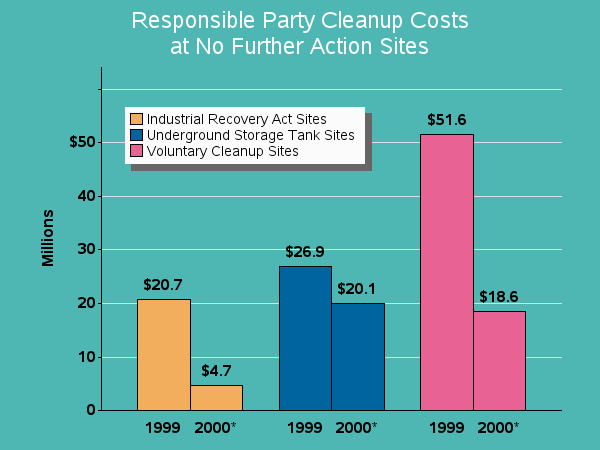
Cleanup Comparison
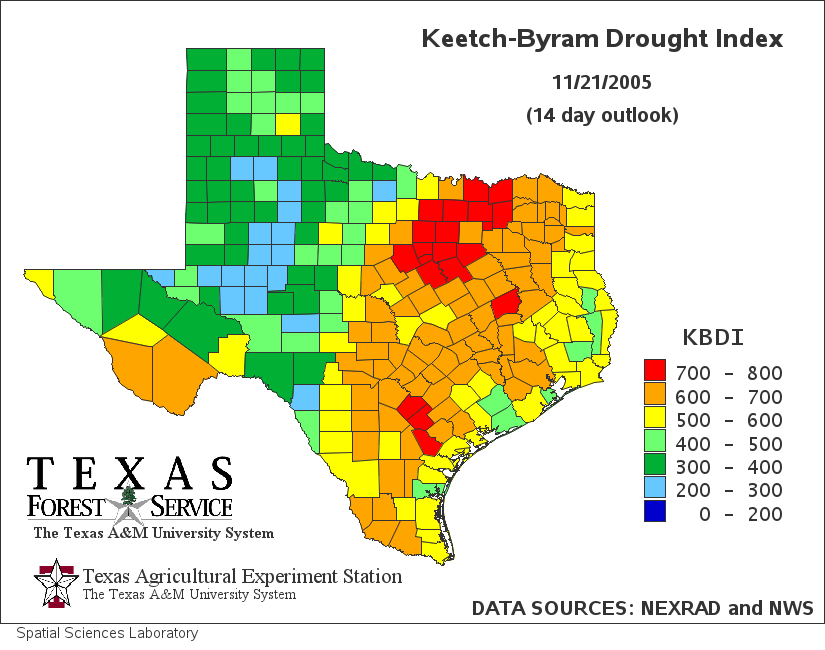
Texas Drought Index
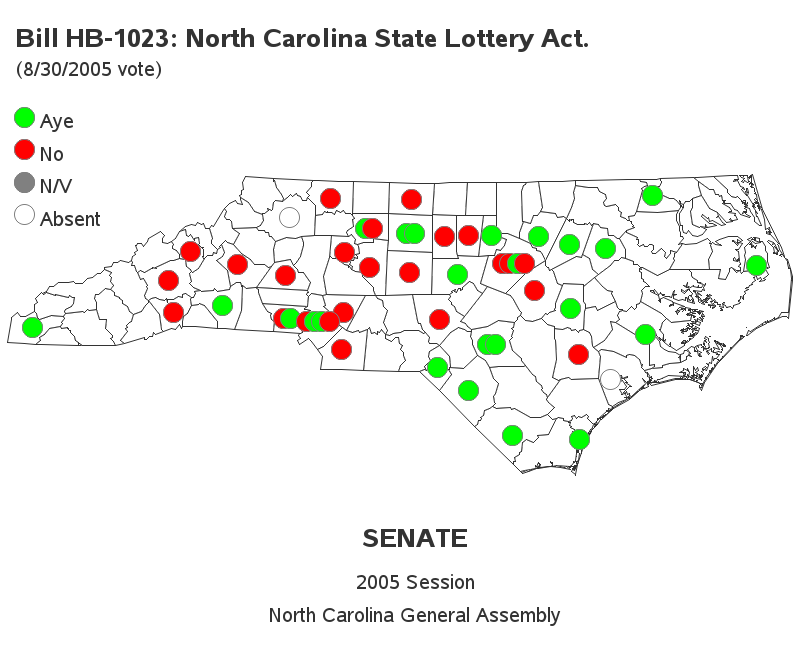
NC Lottery Vote
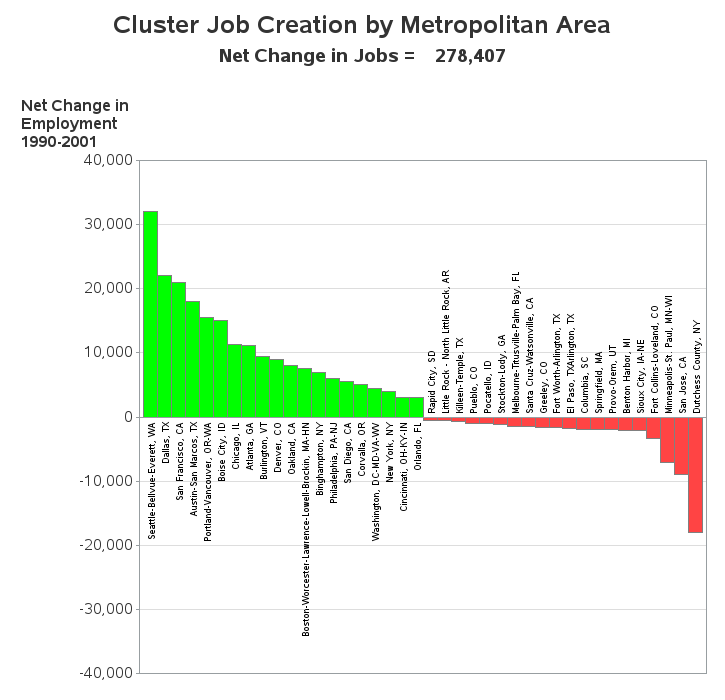

Job Creation Bar Chart
Yet Another Dashboard
Ski Resort Information
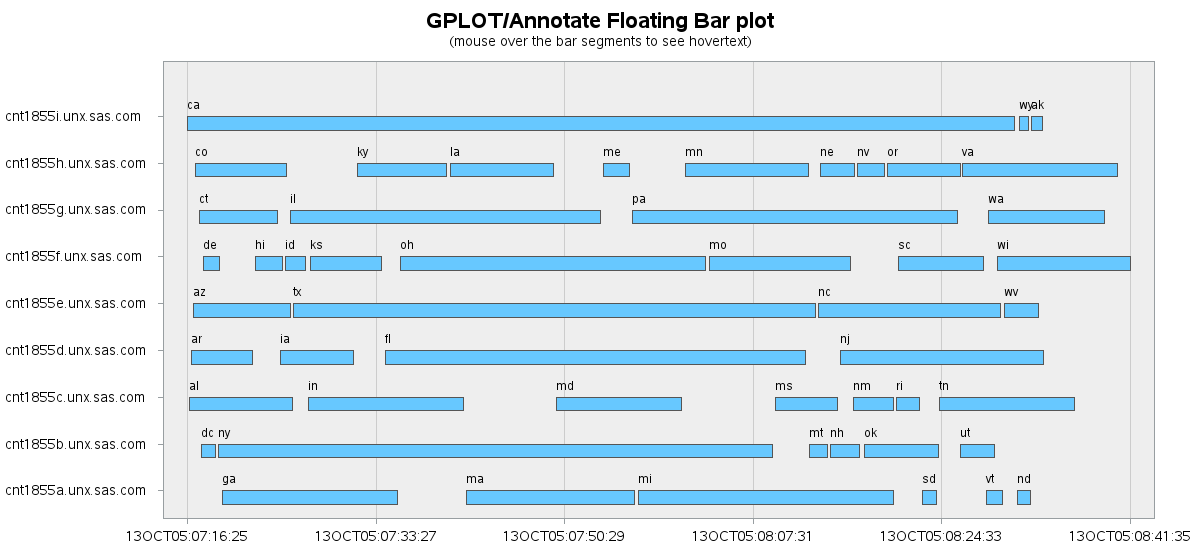
Floating Time Bar Chart
Trellis Comparison Plot
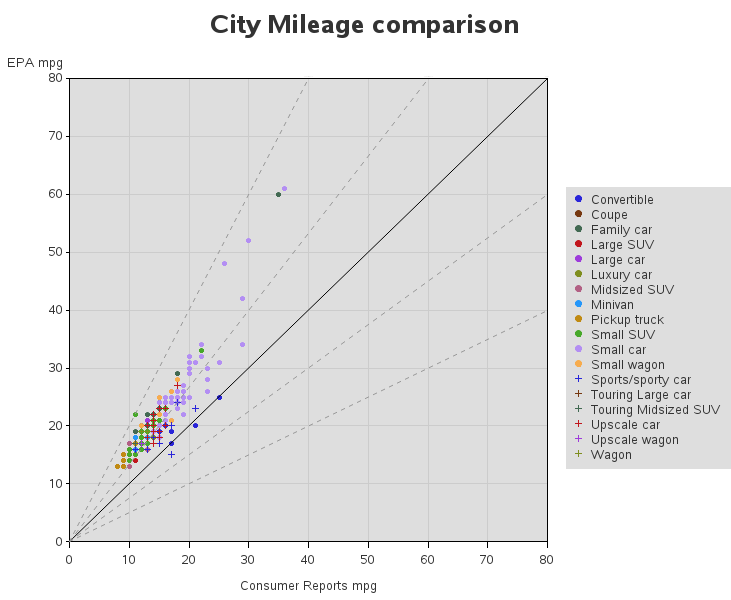
EPA Mileage Compare
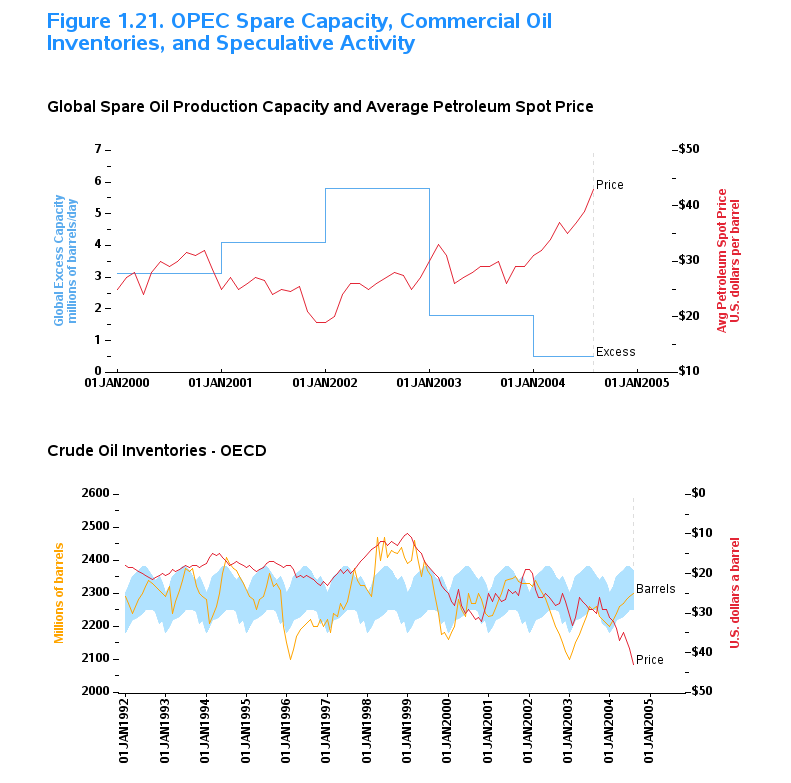
OPEC Oil Analysis
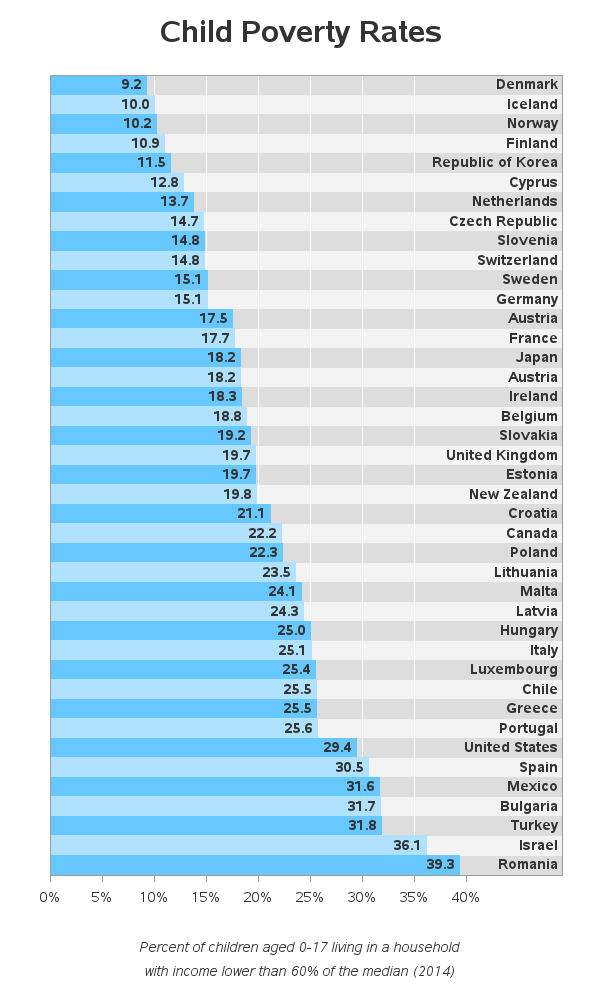
Child Poverty
These samples courtesy of Robert Allison
Please see the following README