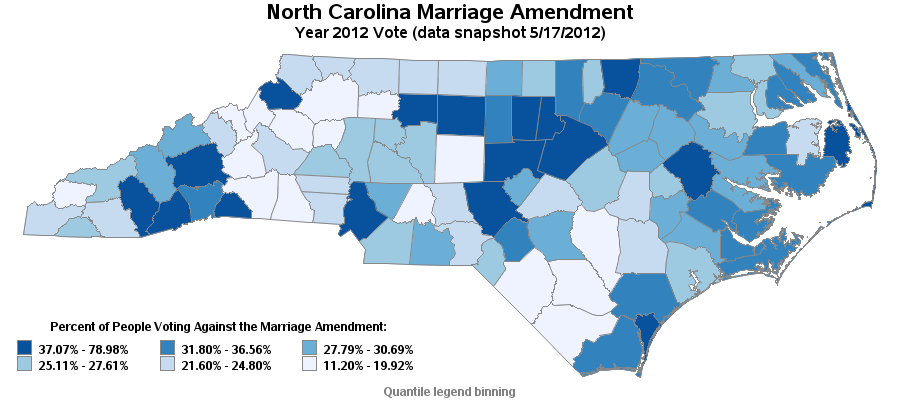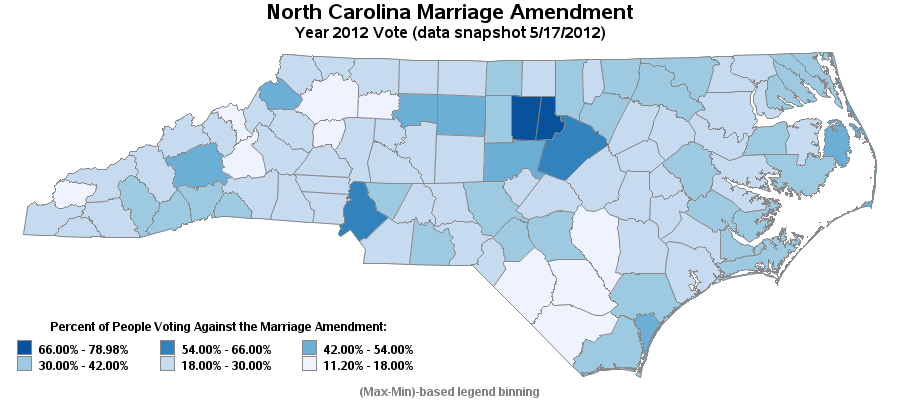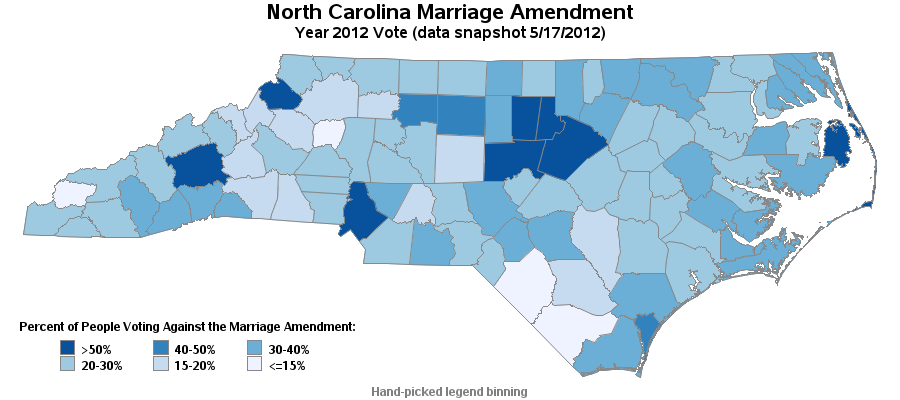
| North Carolina Marriage Amendment |
| Year 2012 Vote (data snapshot 5/17/2012) |
| Obs | county_name | for | against | total | percent_against |
|---|---|---|---|---|---|
| 1 | Orange | 9,627 | 36,173 | 45,800 | 78.98% |
| 2 | Durham | 22,844 | 52,700 | 75,544 | 69.76% |
| 3 | Wake | 106,518 | 140,013 | 246,531 | 56.79% |
| 4 | Mecklenburg | 81,331 | 96,327 | 177,658 | 54.22% |
| 5 | Chatham | 9,556 | 11,172 | 20,728 | 53.90% |
| 6 | Buncombe | 33,900 | 36,024 | 69,924 | 51.52% |
| 7 | Watauga | 7,491 | 7,735 | 15,226 | 50.80% |
| 8 | Dare | 3,752 | 3,845 | 7,597 | 50.61% |
| 9 | Guilford | 58,685 | 58,643 | 117,328 | 49.98% |
| 10 | New Hanover | 22,200 | 22,048 | 44,248 | 49.83% |
| 11 | Forsyth | 42,113 | 37,932 | 80,045 | 47.39% |
| 12 | Polk | 3,229 | 2,050 | 5,279 | 38.83% |
| 13 | Pitt | 19,203 | 12,164 | 31,367 | 38.78% |
| 14 | Jackson | 5,733 | 3,568 | 9,301 | 38.36% |
| 15 | Transylvania | 6,363 | 3,909 | 10,272 | 38.05% |
| 16 | Warren | 2,972 | 1,802 | 4,774 | 37.75% |
| 17 | Moore | 15,262 | 8,990 | 24,252 | 37.07% |
| 18 | Northampton | 3,313 | 1,909 | 5,222 | 36.56% |
| 19 | Alamance | 18,996 | 10,661 | 29,657 | 35.95% |
| 20 | Hyde | 916 | 512 | 1,428 | 35.85% |
| 21 | Washington | 2,287 | 1,270 | 3,557 | 35.70% |
| 22 | Craven | 12,465 | 6,866 | 19,331 | 35.52% |
| 23 | Brunswick | 16,330 | 8,948 | 25,278 | 35.40% |
| 24 | Pasquotank | 3,475 | 1,894 | 5,369 | 35.28% |
| 25 | Hoke | 4,434 | 2,371 | 6,805 | 34.84% |
| 26 | Perquimans | 1,685 | 894 | 2,579 | 34.66% |
| 27 | Franklin | 9,593 | 4,912 | 14,505 | 33.86% |
| 28 | Henderson | 19,625 | 9,990 | 29,615 | 33.73% |
| 29 | Carteret | 11,828 | 6,004 | 17,832 | 33.67% |
| 30 | Pamlico | 2,101 | 1,021 | 3,122 | 32.70% |
| 31 | Granville | 8,372 | 4,036 | 12,408 | 32.53% |
| 32 | Currituck | 2,633 | 1,256 | 3,889 | 32.30% |
| 33 | Halifax | 8,606 | 4,099 | 12,705 | 32.26% |
| 34 | Pender | 6,913 | 3,224 | 10,137 | 31.80% |
| 35 | Caswell | 3,413 | 1,511 | 4,924 | 30.69% |
| 36 | Camden | 995 | 438 | 1,433 | 30.57% |
| 37 | Cumberland | 34,612 | 15,187 | 49,799 | 30.50% |
| 38 | Anson | 3,972 | 1,729 | 5,701 | 30.33% |
| 39 | Cabarrus | 26,003 | 11,181 | 37,184 | 30.07% |
| 40 | Madison | 4,287 | 1,835 | 6,122 | 29.97% |
| 41 | Hertford | 3,831 | 1,635 | 5,466 | 29.91% |
| 42 | Lee | 8,401 | 3,561 | 11,962 | 29.77% |
| 43 | Wilson | 13,687 | 5,790 | 19,477 | 29.73% |
| 44 | Edgecombe | 8,364 | 3,530 | 11,894 | 29.68% |
| 45 | Martin | 4,117 | 1,699 | 5,816 | 29.21% |
| 46 | Beaufort | 8,304 | 3,399 | 11,703 | 29.04% |
| 47 | Jones | 1,830 | 740 | 2,570 | 28.79% |
| 48 | Nash | 17,072 | 6,840 | 23,912 | 28.60% |
| 49 | Lenoir | 8,853 | 3,535 | 12,388 | 28.54% |
| 50 | Haywood | 11,248 | 4,329 | 15,577 | 27.79% |
| 51 | Person | 6,707 | 2,558 | 9,265 | 27.61% |
| 52 | Greene | 3,038 | 1,156 | 4,194 | 27.56% |
| 53 | Onslow | 14,653 | 5,541 | 20,194 | 27.44% |
| 54 | Swain | 2,136 | 803 | 2,939 | 27.32% |
| 55 | Davie | 8,836 | 3,301 | 12,137 | 27.20% |
| 56 | Vance | 7,185 | 2,652 | 9,837 | 26.96% |
| 57 | Bertie | 3,500 | 1,282 | 4,782 | 26.81% |
| 58 | Scotland | 4,749 | 1,730 | 6,479 | 26.70% |
| 59 | Iredell | 25,034 | 9,093 | 34,127 | 26.64% |
| 60 | Union | 29,577 | 10,713 | 40,290 | 26.59% |
| 61 | Johnston | 26,638 | 9,615 | 36,253 | 26.52% |
| 62 | Gates | 1,774 | 634 | 2,408 | 26.33% |
| 63 | Clay | 1,867 | 654 | 2,521 | 25.94% |
| 64 | Catawba | 26,088 | 9,096 | 35,184 | 25.85% |
| 65 | Rowan | 21,689 | 7,524 | 29,213 | 25.76% |
| 66 | Davidson | 25,251 | 8,602 | 33,853 | 25.41% |
| 67 | Chowan | 2,282 | 765 | 3,047 | 25.11% |
| 68 | Harnett | 14,796 | 4,880 | 19,676 | 24.80% |
| 69 | Rockingham | 14,931 | 4,867 | 19,798 | 24.58% |
| 70 | Macon | 6,388 | 2,073 | 8,461 | 24.50% |
| 71 | Wayne | 17,385 | 5,599 | 22,984 | 24.36% |
| 72 | Yancey | 4,804 | 1,512 | 6,316 | 23.94% |
| 73 | Montgomery | 4,531 | 1,388 | 5,919 | 23.45% |
| 74 | Gaston | 31,942 | 9,723 | 41,665 | 23.34% |
| 75 | Ashe | 6,277 | 1,860 | 8,137 | 22.86% |
| 76 | Richmond | 7,234 | 2,119 | 9,353 | 22.66% |
| 77 | Lincoln | 15,304 | 4,479 | 19,783 | 22.64% |
| 78 | Burke | 15,338 | 4,477 | 19,815 | 22.59% |
| 79 | Stokes | 8,616 | 2,470 | 11,086 | 22.28% |
| 80 | Alleghany | 2,534 | 710 | 3,244 | 21.89% |
| 81 | Duplin | 7,313 | 2,041 | 9,354 | 21.82% |
| 82 | Cherokee | 5,073 | 1,409 | 6,482 | 21.74% |
| 83 | Tyrrell | 732 | 203 | 935 | 21.71% |
| 84 | Surry | 12,205 | 3,363 | 15,568 | 21.60% |
| 85 | Cleveland | 18,015 | 4,481 | 22,496 | 19.92% |
| 86 | Randolph | 25,145 | 6,112 | 31,257 | 19.55% |
| 87 | Stanly | 12,756 | 3,096 | 15,852 | 19.53% |
| 88 | Caldwell | 16,111 | 3,882 | 19,993 | 19.42% |
| 89 | Avery | 4,300 | 1,023 | 5,323 | 19.22% |
| 90 | Rutherford | 11,714 | 2,740 | 14,454 | 18.96% |
| 91 | Sampson | 10,736 | 2,345 | 13,081 | 17.93% |
| 92 | Yadkin | 8,203 | 1,749 | 9,952 | 17.57% |
| 93 | McDowell | 8,354 | 1,728 | 10,082 | 17.14% |
| 94 | Wilkes | 15,652 | 3,223 | 18,875 | 17.08% |
| 95 | Mitchell | 4,814 | 990 | 5,804 | 17.06% |
| 96 | Bladen | 7,412 | 1,489 | 8,901 | 16.73% |
| 97 | Columbus | 10,850 | 1,906 | 12,756 | 14.94% |
| 98 | Alexander | 9,543 | 1,554 | 11,097 | 14.00% |
| 99 | Robeson | 21,504 | 3,399 | 24,903 | 13.65% |
| 100 | Graham | 2,323 | 293 | 2,616 | 11.20% |