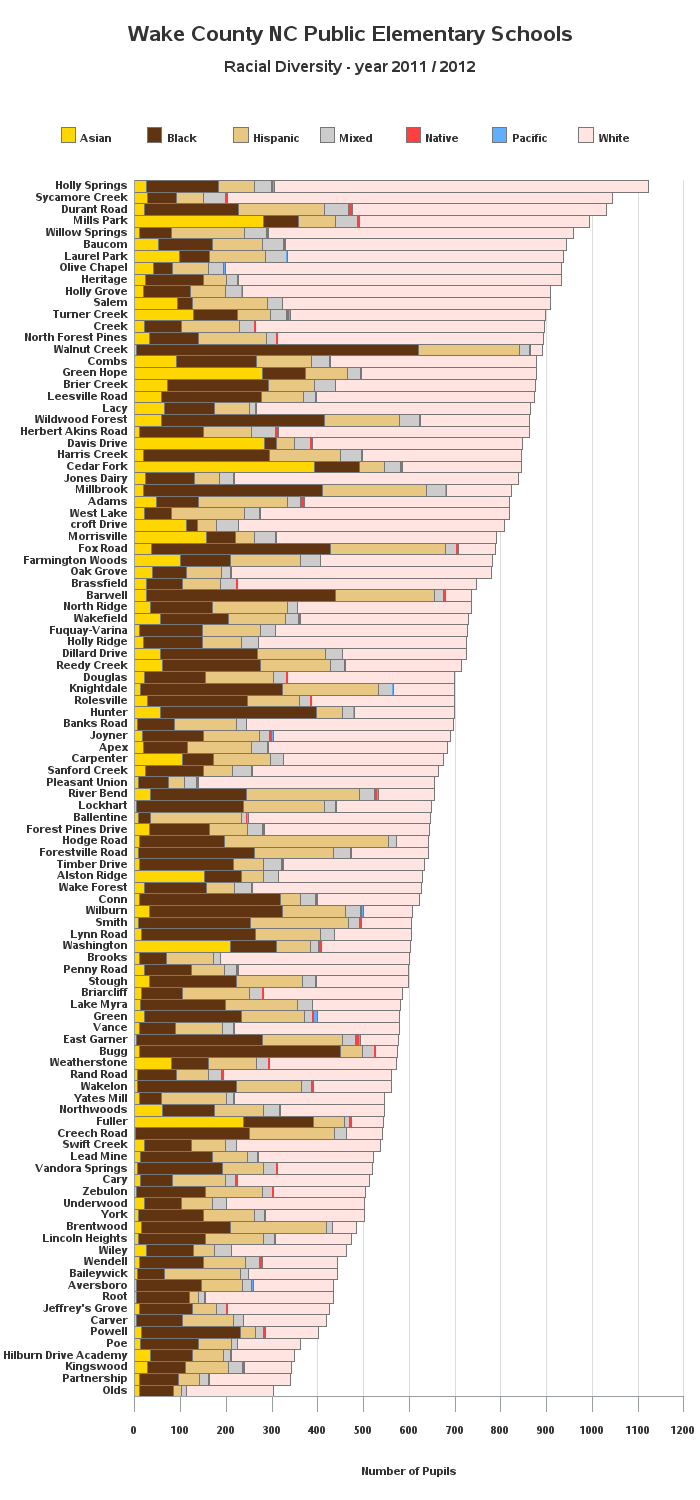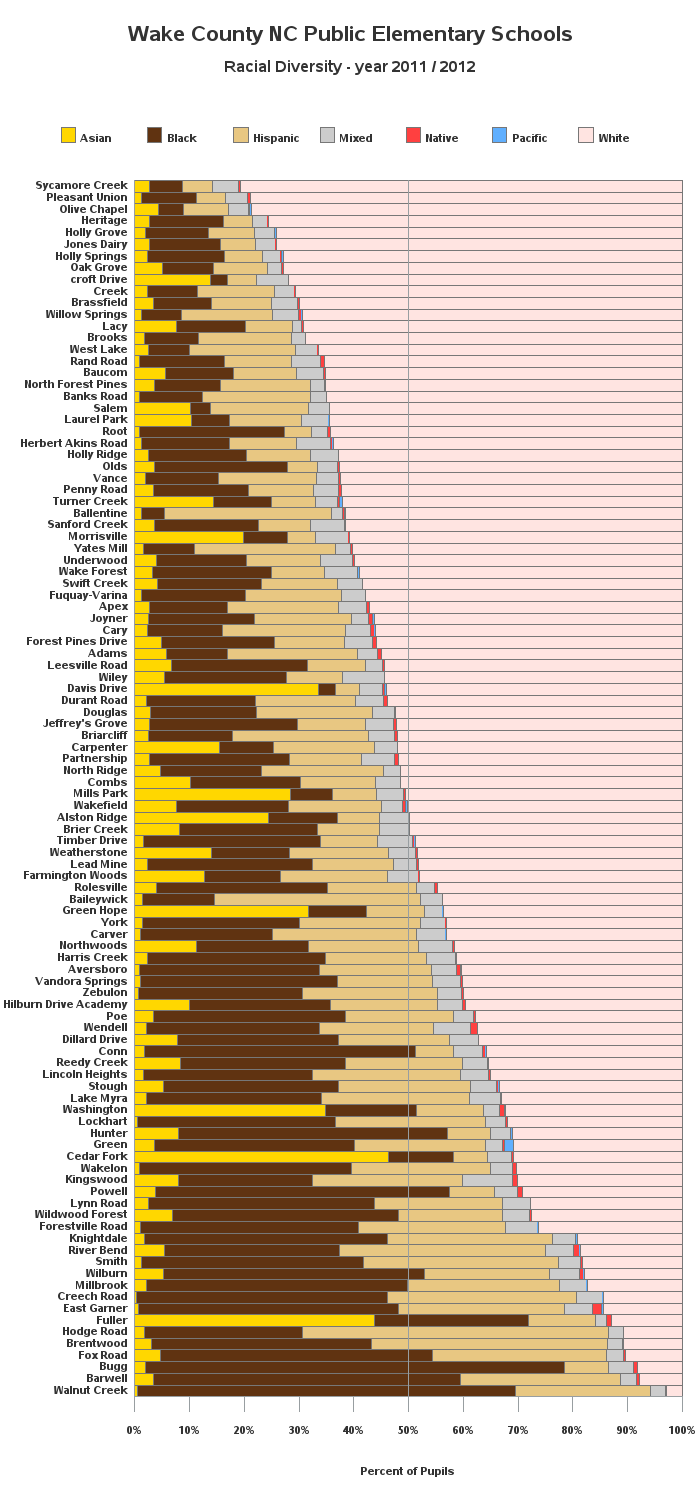
| Wake County NC Public Elementary Schools |
| Racial Diversity - year 2011 / 2012 |
| School Name | Asian | Black or African American |
Hispanic/Latino | 2 or more races |
Native American |
Pacific Islander |
White | Total |
|---|---|---|---|---|---|---|---|---|
| Adams Elementary | 48 | 90 | 196 | 29 | 6 | 1 | 450 | 820 |
| Alston Ridge Elementary | 153 | 80 | 48 | 34 | . | . | 314 | 629 |
| Apex Elementary | 18 | 98 | 138 | 36 | 3 | . | 391 | 684 |
| Aversboro Elementary | 4 | 142 | 89 | 20 | 3 | 1 | 175 | 434 |
| Baileywick Elementary | 6 | 58 | 167 | 17 | . | . | 194 | 442 |
| Ballentine Elementary | 8 | 27 | 197 | 13 | 2 | 1 | 398 | 646 |
| Banks Road Elementary | 6 | 80 | 137 | 20 | 1 | . | 452 | 696 |
| Barwell Elementary | 25 | 413 | 216 | 21 | 4 | 1 | 57 | 737 |
| Baucom Elementary | 52 | 118 | 109 | 46 | 3 | 1 | 614 | 943 |
| Brassfield Elementary | 25 | 80 | 82 | 35 | 2 | 1 | 522 | 747 |
| Brentwood Elementary | 15 | 194 | 209 | 13 | . | 1 | 52 | 484 |
| Briarcliff Elementary | 15 | 89 | 146 | 28 | 3 | . | 305 | 586 |
| Brier Creek Elementary | 72 | 220 | 100 | 47 | . | . | 437 | 876 |
| Brooks Elementary | 10 | 60 | 102 | 15 | . | . | 414 | 601 |
| Bugg Elementary | 11 | 439 | 47 | 26 | 4 | . | 47 | 574 |
| Carpenter Elementary | 104 | 67 | 125 | 28 | . | . | 351 | 675 |
| Carver Elementary | 4 | 101 | 110 | 22 | . | 1 | 180 | 418 |
| Cary Elementary | 12 | 70 | 115 | 23 | 4 | 1 | 287 | 512 |
| Cedar Fork Elementary | 392 | 100 | 53 | 36 | 3 | 1 | 260 | 845 |
| Combs Elementary | 90 | 176 | 120 | 40 | 1 | . | 452 | 879 |
| Conn Elementary | 11 | 308 | 43 | 33 | 3 | 2 | 222 | 622 |
| Creech Road Elementary | 2 | 248 | 186 | 26 | . | 1 | 78 | 541 |
| Davis Drive Elementary | 284 | 26 | 38 | 35 | 4 | 2 | 458 | 847 |
| Dillard Drive Elementary | 56 | 213 | 147 | 38 | . | . | 270 | 724 |
| Douglas Elementary | 20 | 135 | 149 | 28 | 1 | . | 366 | 699 |
| Durant Road Elementary | 21 | 206 | 188 | 52 | 8 | . | 555 | 1030 |
| East Garner Elementary | 4 | 274 | 175 | 29 | 10 | 2 | 83 | 577 |
| Farmington Woods Elementary | 100 | 108 | 153 | 44 | 1 | . | 375 | 781 |
| Forest Pines Drive Elementary | 31 | 133 | 83 | 33 | 4 | . | 360 | 644 |
| Forestville Road Elementary | 7 | 255 | 172 | 38 | . | 1 | 168 | 641 |
| Fox Road Elementary | 37 | 391 | 251 | 25 | 2 | 1 | 81 | 788 |
| Fuller Elementary | 238 | 153 | 67 | 11 | 5 | . | 70 | 544 |
| Fuquay-Varina Elementary | 9 | 138 | 128 | 32 | . | . | 421 | 728 |
| Green Elementary | 21 | 211 | 139 | 18 | 2 | 9 | 179 | 579 |
| Green Hope Elementary | 279 | 93 | 93 | 29 | . | 2 | 383 | 879 |
| Harris Creek Elementary | 19 | 275 | 156 | 46 | 1 | . | 349 | 846 |
| Herbert Akins Road Elementary | 11 | 138 | 105 | 54 | 3 | 2 | 549 | 862 |
| Heritage Elementary | 24 | 127 | 50 | 24 | 2 | . | 705 | 932 |
| Highcroft Drive Elementary | 112 | 25 | 42 | 47 | . | . | 581 | 807 |
| Hilburn Drive Academy | 35 | 90 | 68 | 16 | 2 | . | 138 | 349 |
| Hodge Road Elementary | 11 | 185 | 359 | 18 | . | . | 69 | 642 |
| Holly Grove Elementary | 18 | 104 | 76 | 34 | 1 | 2 | 674 | 909 |
| Holly Ridge Elementary | 18 | 130 | 85 | 37 | . | . | 455 | 725 |
| Holly Springs Elementary | 25 | 158 | 79 | 37 | 2 | 4 | 819 | 1124 |
| Hunter Elementary | 56 | 342 | 56 | 25 | . | 2 | 217 | 698 |
| Jeffrey's Grove Elementary | 11 | 115 | 53 | 22 | 2 | . | 222 | 425 |
| Jones Dairy Elementary | 23 | 108 | 53 | 31 | 2 | . | 621 | 838 |
| Joyner Elementary | 17 | 134 | 122 | 22 | 5 | 2 | 389 | 691 |
| Kingswood Elementary | 27 | 84 | 94 | 31 | 3 | . | 103 | 342 |
| Knightdale Elementary | 12 | 310 | 211 | 30 | 1 | 1 | 134 | 699 |
| Lacy Elementary | 65 | 110 | 75 | 14 | 2 | . | 600 | 866 |
| Lake Myra Elementary | 12 | 186 | 157 | 33 | 1 | . | 192 | 581 |
| Laurel Park Elementary | 97 | 65 | 123 | 46 | 1 | 2 | 604 | 938 |
| Lead Mine Elementary | 12 | 157 | 77 | 22 | 2 | . | 251 | 521 |
| Leesville Road Elementary | 58 | 218 | 92 | 27 | 3 | . | 475 | 873 |
| Lincoln Heights Elementary | 7 | 147 | 128 | 24 | 2 | . | 166 | 474 |
| Lockhart Elementary | 3 | 235 | 177 | 24 | 2 | . | 207 | 648 |
| Lynn Road Elementary | 15 | 249 | 142 | 30 | . | . | 168 | 604 |
| Middle Creek Elementary | 20 | 82 | 126 | 33 | 2 | . | 632 | 895 |
| Millbrook Elementary | 18 | 392 | 228 | 41 | . | 2 | 142 | 823 |
| Mills Park Elementary | 282 | 76 | 81 | 48 | 3 | 1 | 502 | 993 |
| Morrisville Elementary | 157 | 63 | 41 | 47 | 1 | . | 481 | 790 |
| North Forest Pines Elementary | 32 | 108 | 147 | 23 | 1 | 1 | 582 | 894 |
| North Ridge Elementary | 34 | 136 | 164 | 22 | . | . | 379 | 735 |
| Northwoods Elementary | 61 | 112 | 109 | 34 | 2 | . | 227 | 545 |
| Oak Grove Elementary | 39 | 73 | 77 | 20 | 3 | . | 567 | 779 |
| Olds Elementary | 11 | 73 | 17 | 11 | 1 | . | 189 | 302 |
| Olive Chapel Elementary | 40 | 43 | 77 | 34 | 1 | 3 | 735 | 933 |
| Partnership Elementary | 9 | 87 | 45 | 20 | 3 | . | 176 | 340 |
| Penny Road Elementary | 20 | 104 | 71 | 28 | 3 | . | 373 | 599 |
| Pleasant Union Elementary | 8 | 66 | 34 | 27 | 3 | . | 516 | 654 |
| Poe Elementary | 12 | 127 | 72 | 13 | 1 | . | 137 | 362 |
| Powell Elementary | 15 | 216 | 33 | 17 | 4 | . | 117 | 402 |
| Rand Road Elementary | 5 | 87 | 69 | 29 | 4 | . | 367 | 561 |
| Reedy Creek Elementary | 60 | 214 | 153 | 32 | 2 | . | 252 | 713 |
| River Bend Elementary | 35 | 210 | 245 | 34 | 7 | 2 | 121 | 654 |
| Rolesville Elementary | 27 | 219 | 114 | 23 | 3 | 1 | 312 | 699 |
| Root Elementary | 4 | 115 | 21 | 13 | 2 | . | 279 | 434 |
| Salem Elementary | 93 | 32 | 164 | 34 | . | . | 586 | 909 |
| Sanford Creek Elementary | 24 | 126 | 63 | 41 | 1 | 1 | 408 | 664 |
| Smith Elementary | 7 | 246 | 215 | 24 | 3 | . | 110 | 605 |
| Stough Elementary | 31 | 191 | 145 | 28 | 2 | 1 | 200 | 598 |
| Swift Creek Elementary | 22 | 102 | 74 | 25 | . | . | 313 | 536 |
| Sycamore Creek Elementary | 28 | 63 | 58 | 49 | 4 | . | 843 | 1045 |
| Timber Drive Elementary | 10 | 205 | 66 | 40 | 2 | 1 | 309 | 633 |
| Turner Creek Elementary | 129 | 95 | 72 | 36 | 4 | 4 | 557 | 897 |
| Underwood Elementary | 20 | 82 | 68 | 30 | 1 | . | 301 | 502 |
| Vance Elementary | 11 | 77 | 104 | 23 | 3 | . | 361 | 579 |
| Vandora Springs Elementary | 5 | 187 | 90 | 27 | 2 | . | 208 | 519 |
| Wake Forest Elementary | 20 | 136 | 61 | 38 | 1 | 1 | 369 | 626 |
| Wakefield Elementary | 55 | 150 | 124 | 28 | 4 | 2 | 366 | 729 |
| Wakelon Elementary | 5 | 217 | 142 | 23 | 4 | . | 170 | 561 |
| Walnut Creek Elementary | 4 | 615 | 221 | 23 | 2 | . | 26 | 891 |
| Washington Elementary | 210 | 100 | 74 | 18 | 5 | 1 | 195 | 603 |
| Weatherstone Elementary | 80 | 81 | 104 | 28 | 2 | . | 276 | 571 |
| Wendell Elementary | 9 | 141 | 92 | 30 | 6 | . | 166 | 444 |
| West Lake Elementary | 21 | 60 | 159 | 33 | 1 | . | 545 | 819 |
| Wilburn Elementary | 32 | 290 | 138 | 34 | 4 | 1 | 109 | 608 |
| Wildwood Forest Elementary | 59 | 356 | 164 | 43 | 3 | . | 238 | 863 |
| Wiley Elementary | 25 | 103 | 47 | 36 | . | . | 251 | 462 |
| Willow Springs Elementary | 11 | 70 | 159 | 47 | 4 | 2 | 665 | 958 |
| Yates Mill Elementary | 9 | 50 | 141 | 15 | 2 | . | 329 | 546 |
| York Elementary | 7 | 144 | 110 | 23 | 1 | . | 216 | 501 |
| Zebulon Elementary | 3 | 151 | 125 | 22 | 2 | . | 201 | 504 |