Robert Allison's SAS/Graph Examples #7
Click on thumbnail to see full-size chart.
Click on label to see explanation and SAS code.
SAS Version of 'Microsoft Excel' Charts
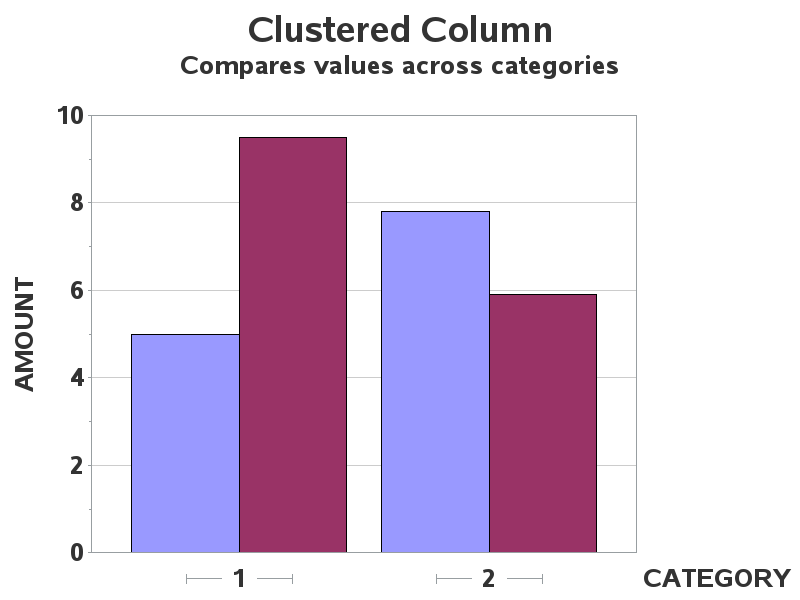
Clustered Column Chart
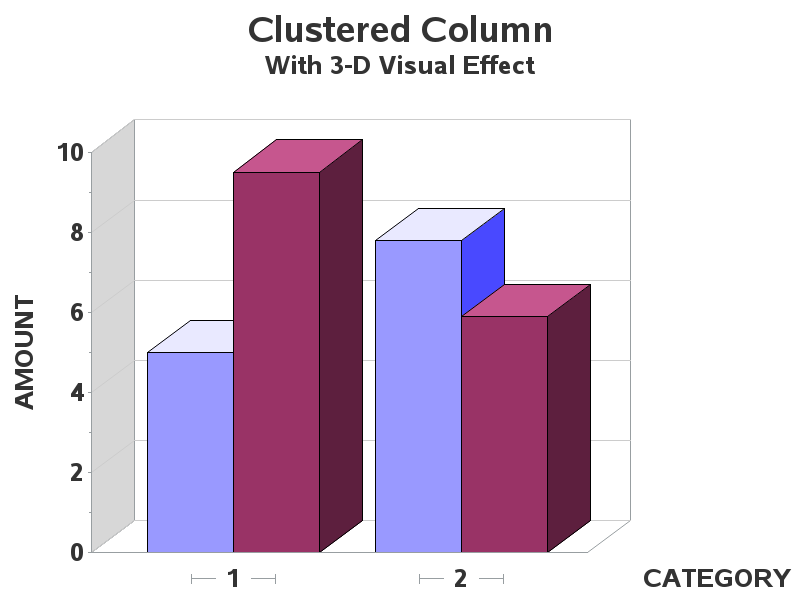
Clustered Column (3D)
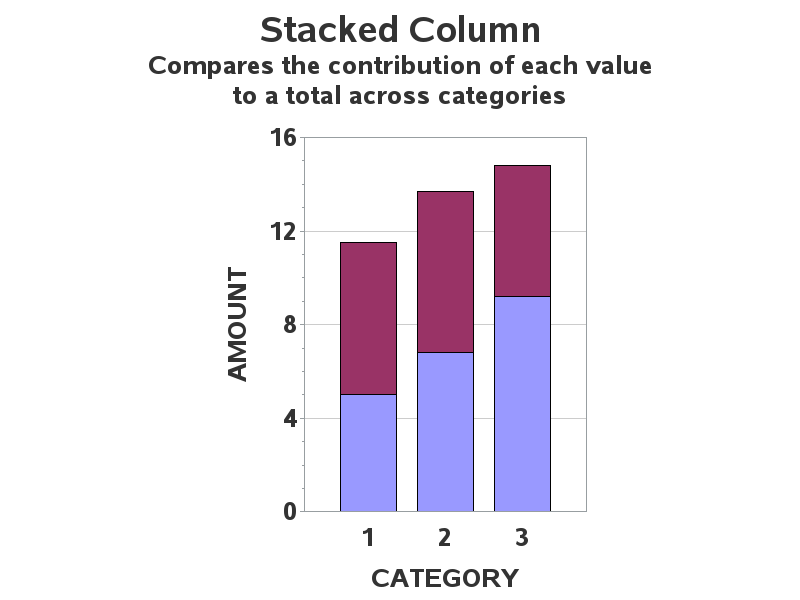
Stacked Column
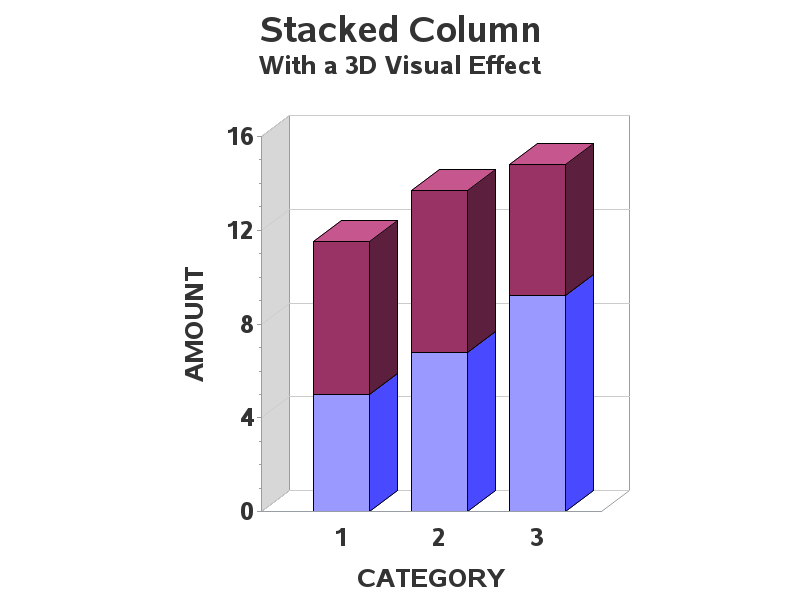
Stacked Column (3D)
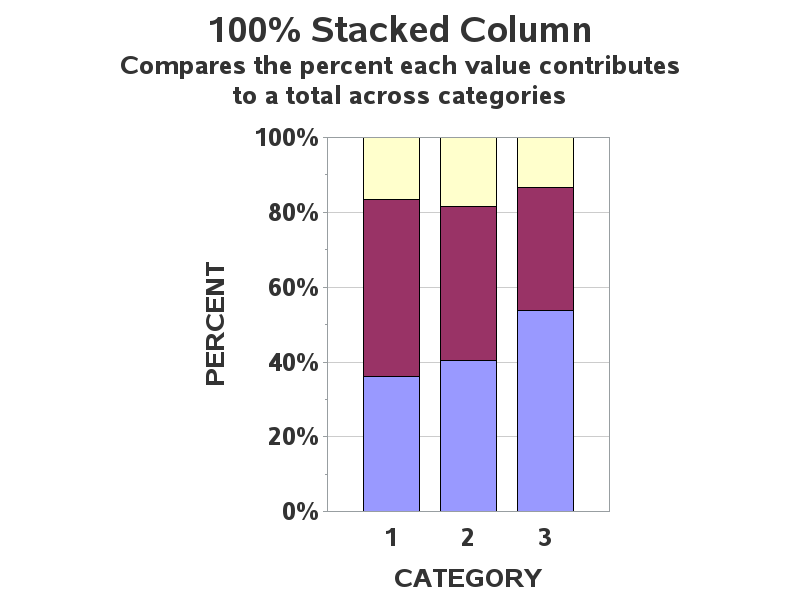

100% Stacked Column
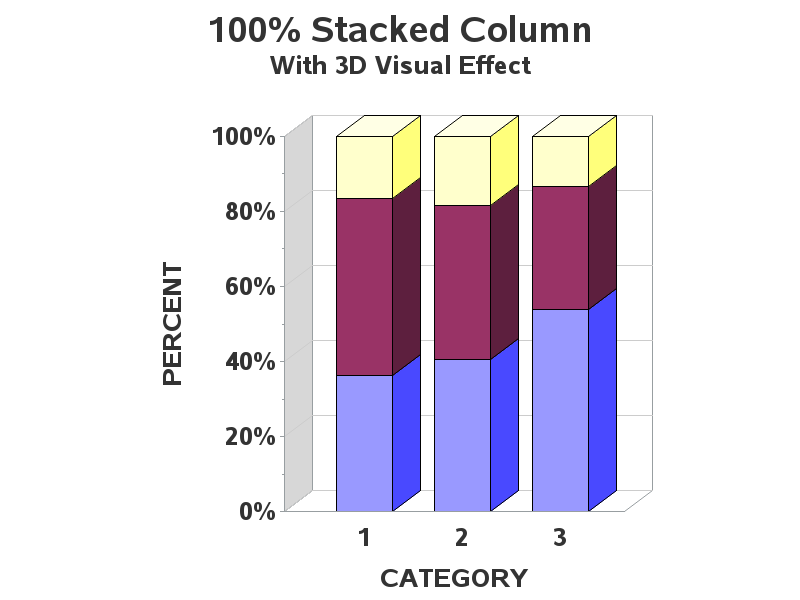
100% Stacked (3D)
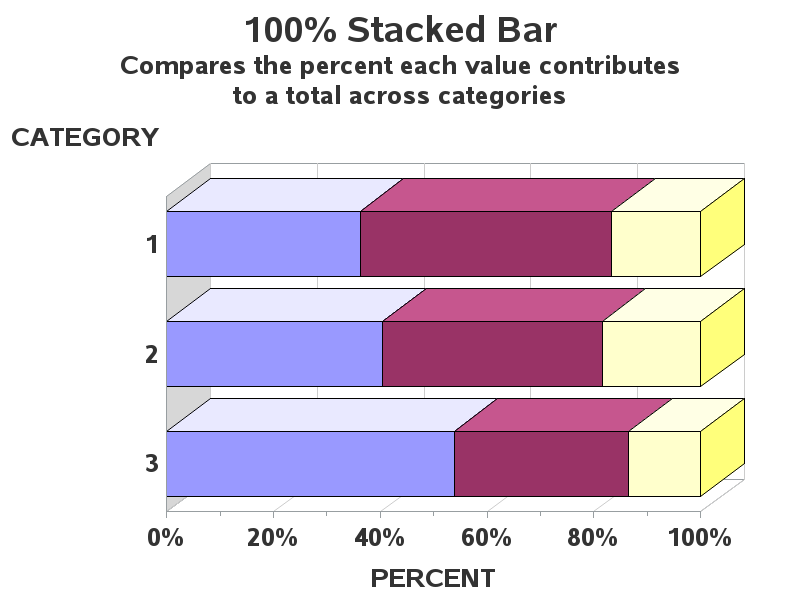
100% Stacked Bar
100% Stacked Bar (3D)
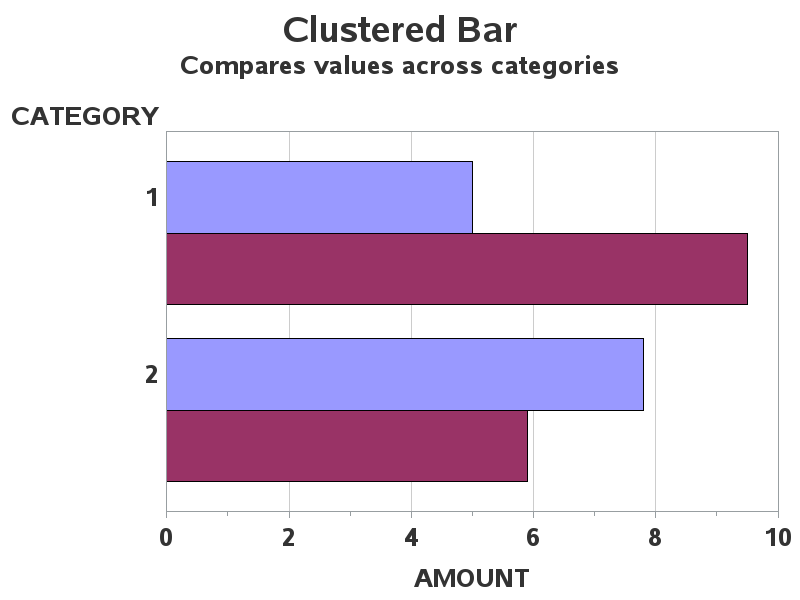

Clustered Bar Chart (2D)
Clustered Bar Chart (3D)
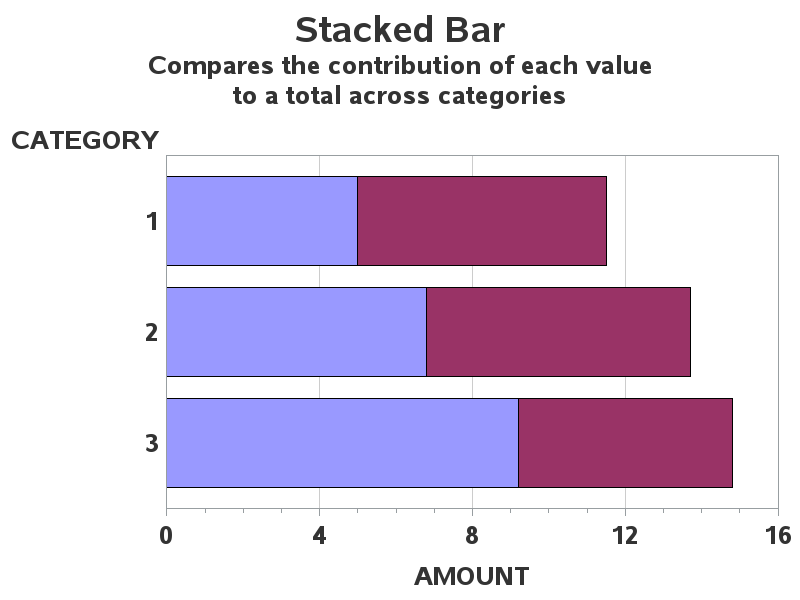
Stacked Bar Chart (2D)
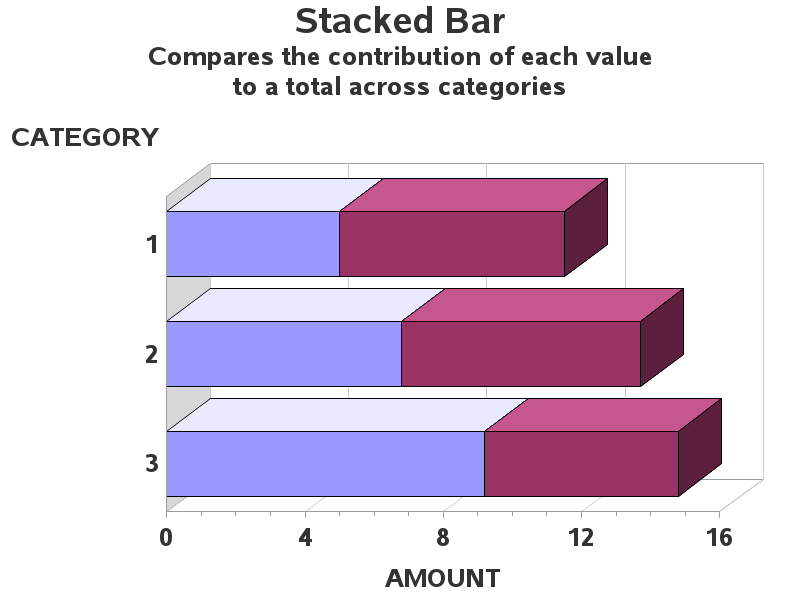
Stacked Bar Chart (3D)
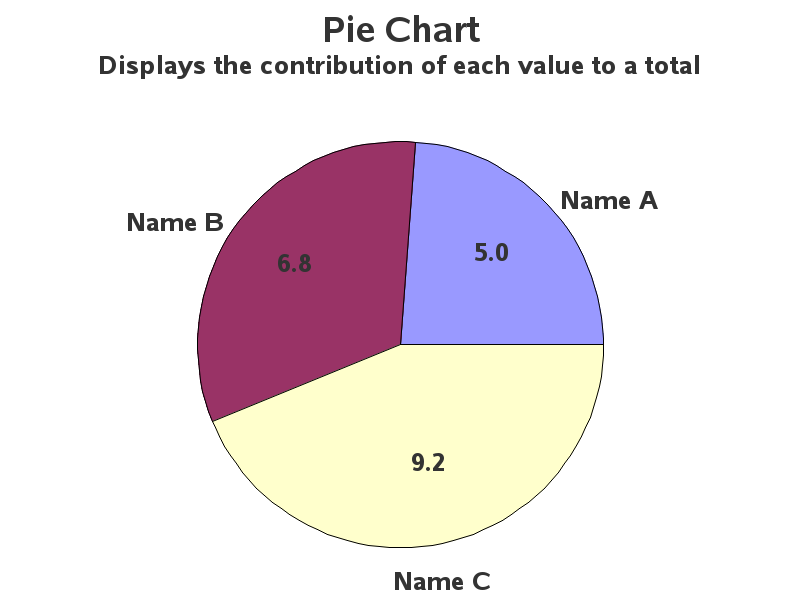
Simple 2D Pie Chart
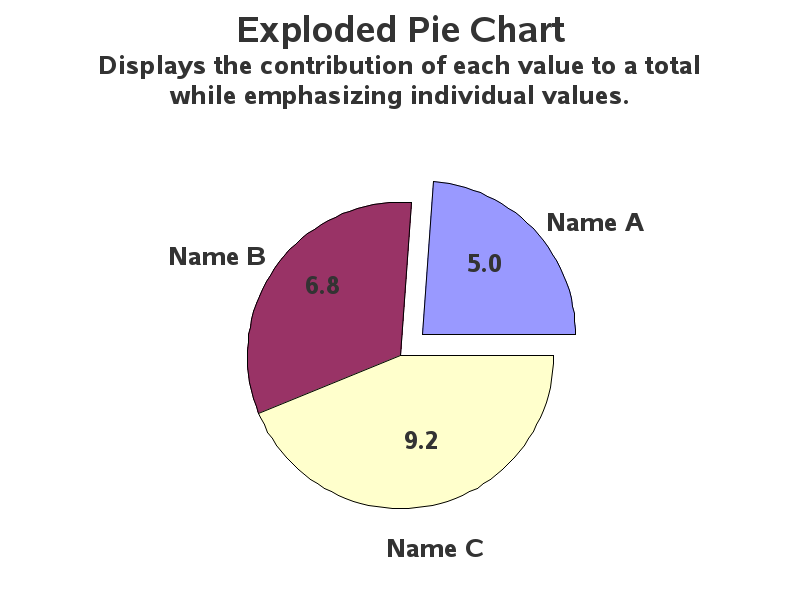
Exploded 2D Pie Chart
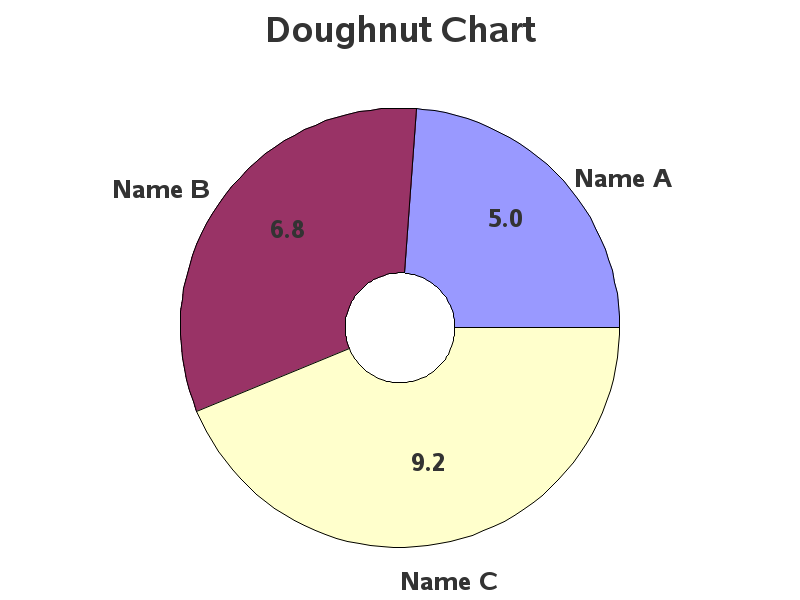
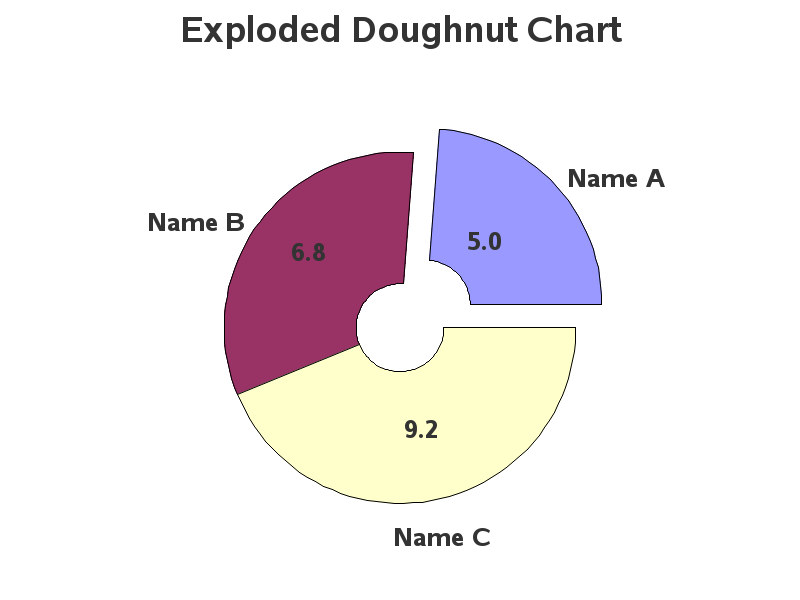
Doughnut Pie Chart
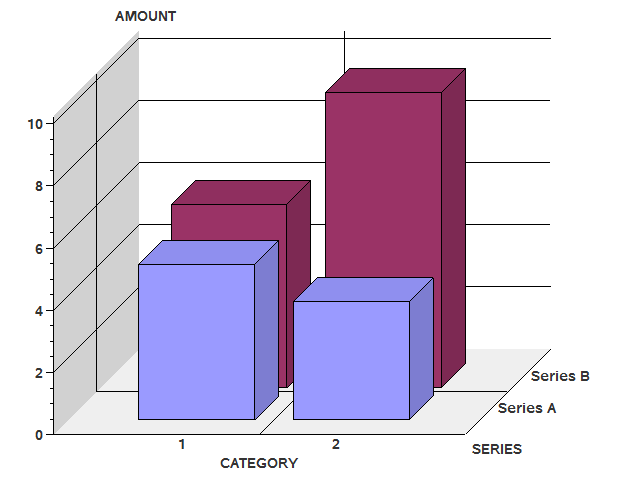
3D Column Chart
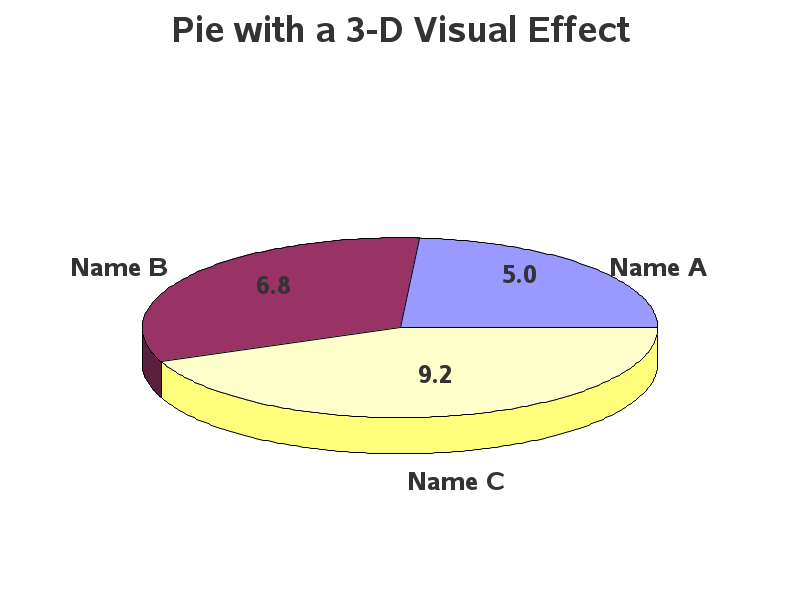
Pie w/ 3D Visual Effect
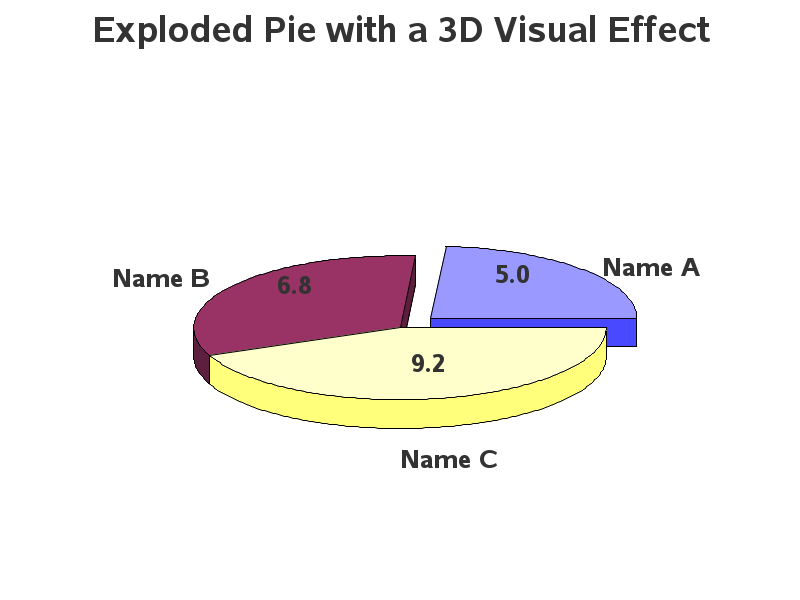
Exploded 3D Pie Chart
3D Doughnut Chart
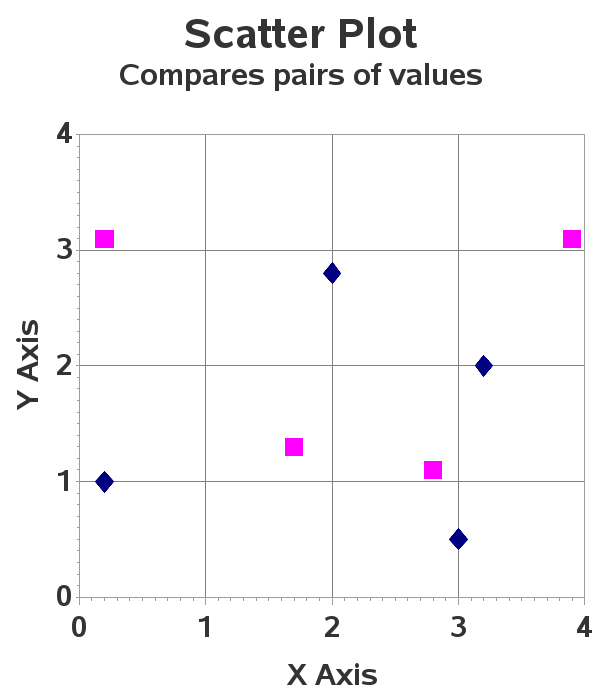
Simple Scatter Plot
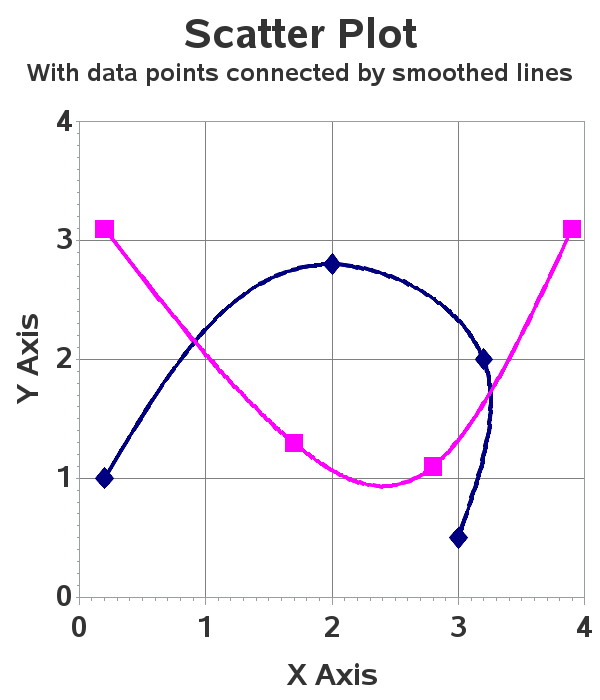
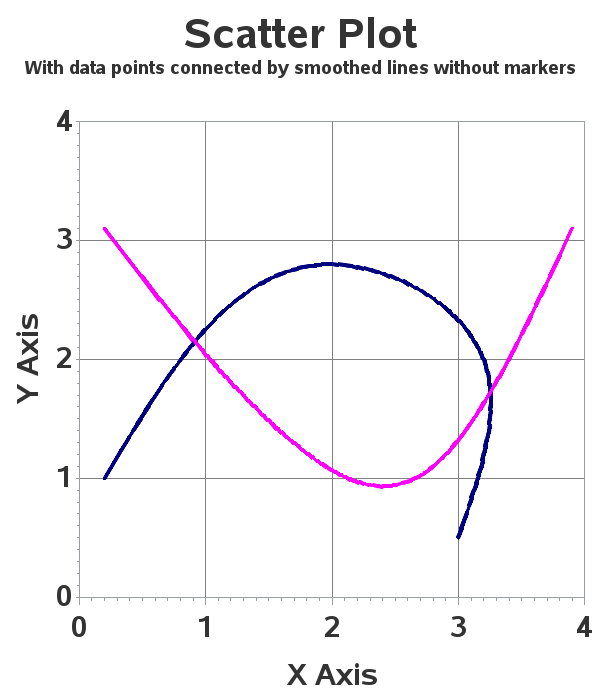
Scatter w/ Smoothed Line
Without Markers
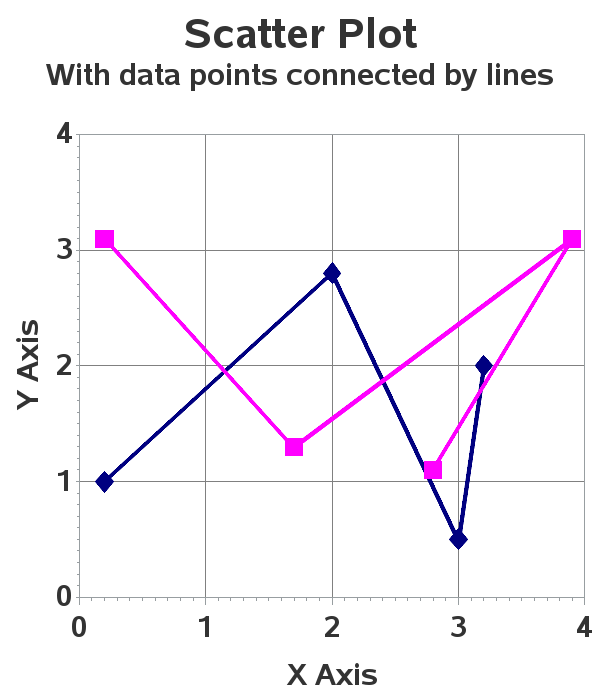
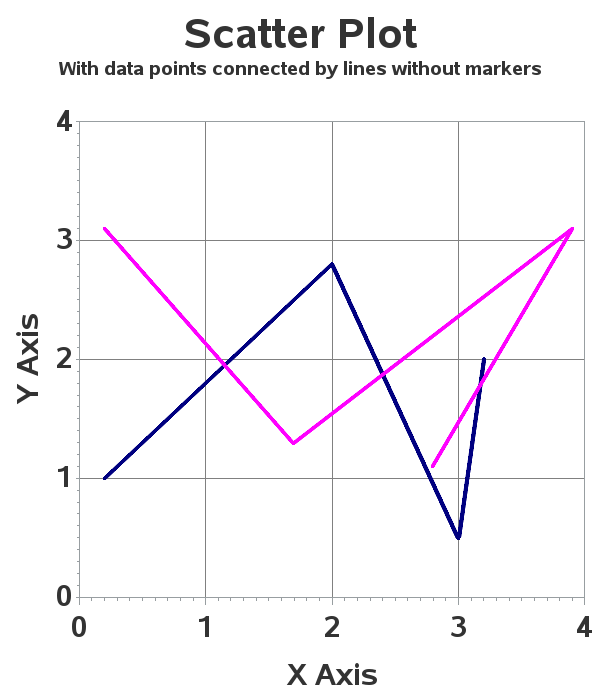
Scatter w/ Straight Line
Without Markers
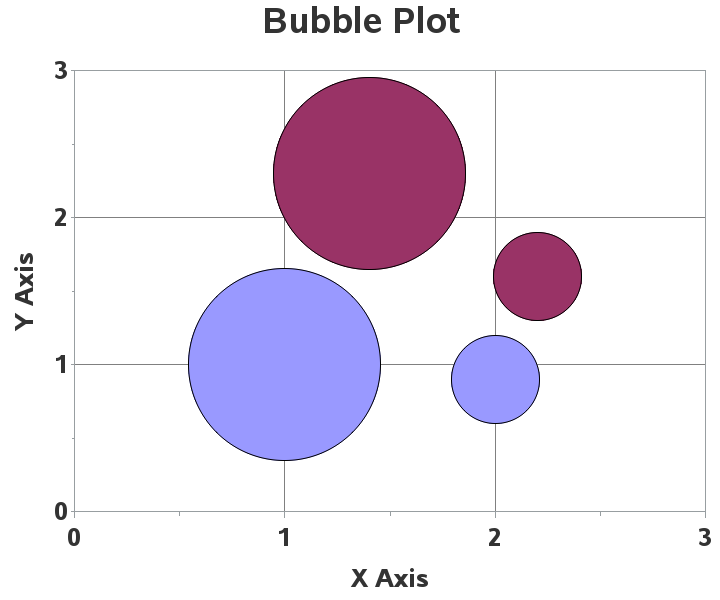
Simple 2D Bubble Plot
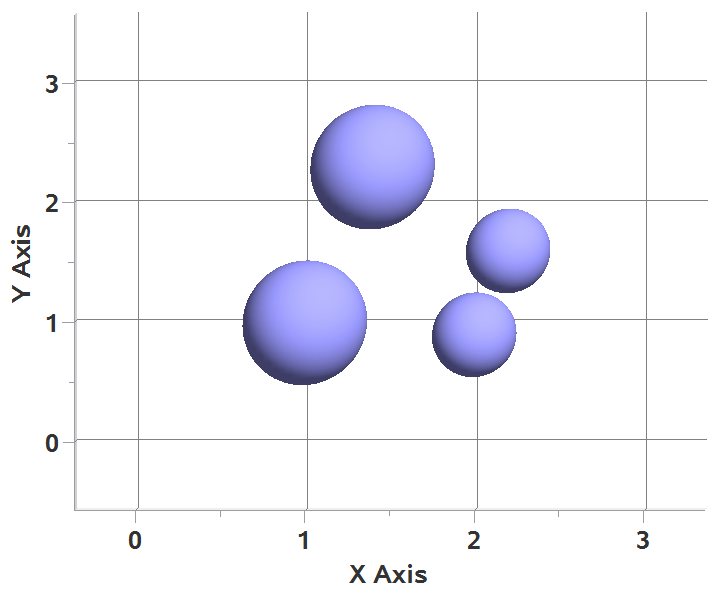
Bubble w/ 3D Effect
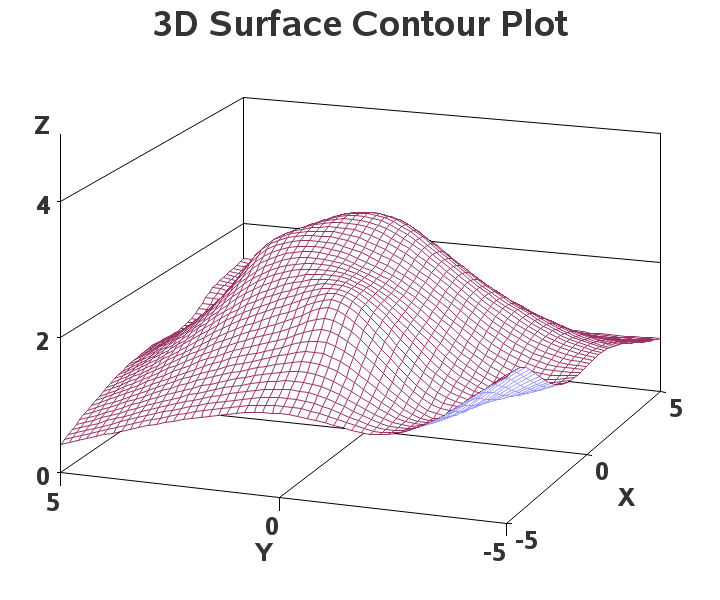
3D Surface Contour
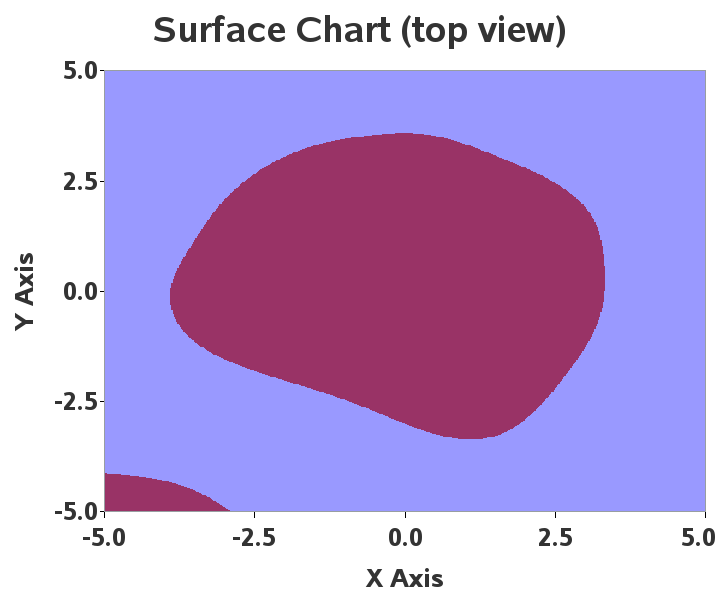
Surface Chart (top view)

Simple 2D Area Plot
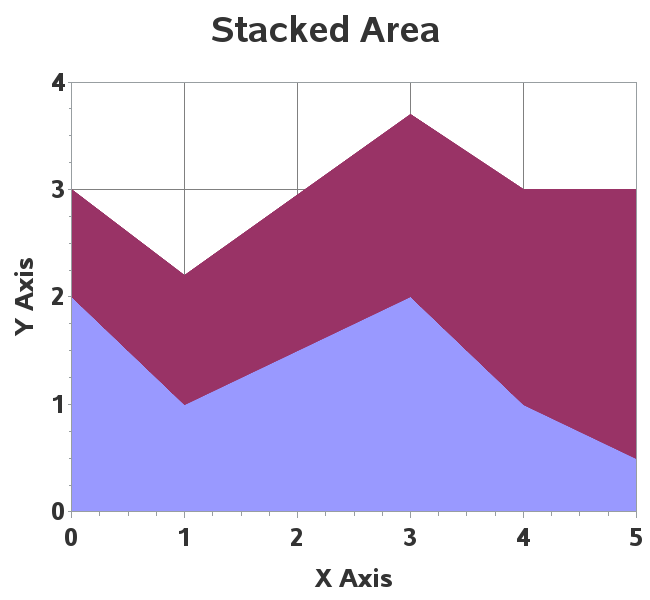
Simple Stacked Area Plot
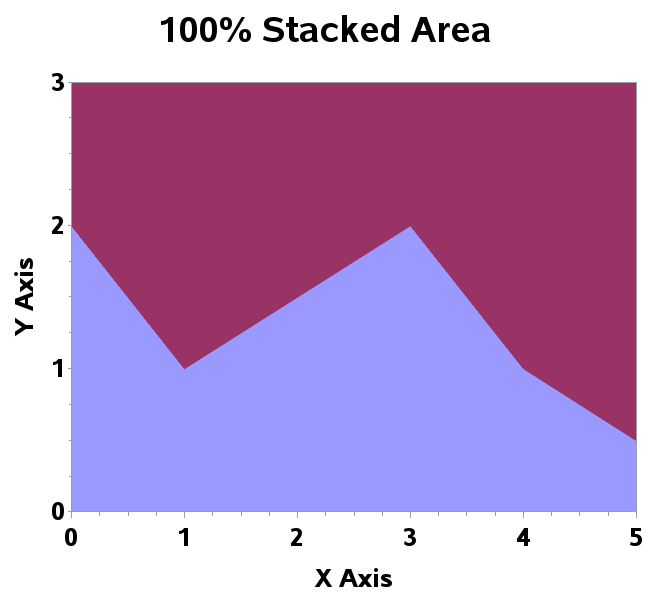
100% Stacked Area
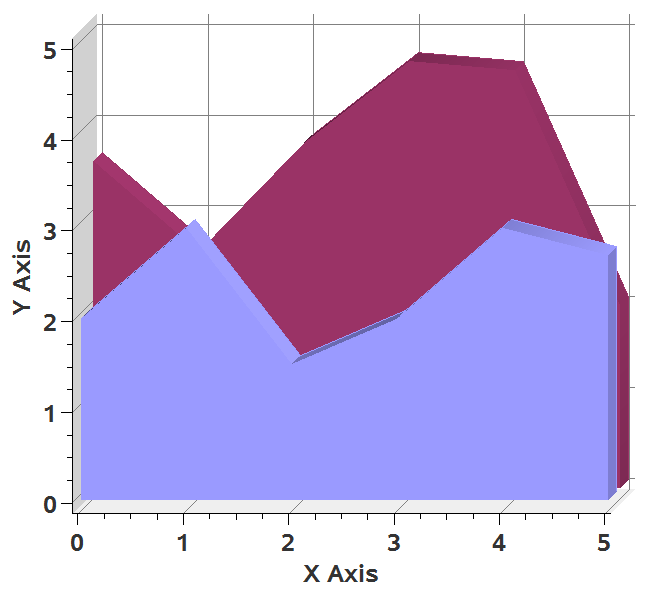
3D Area Chart
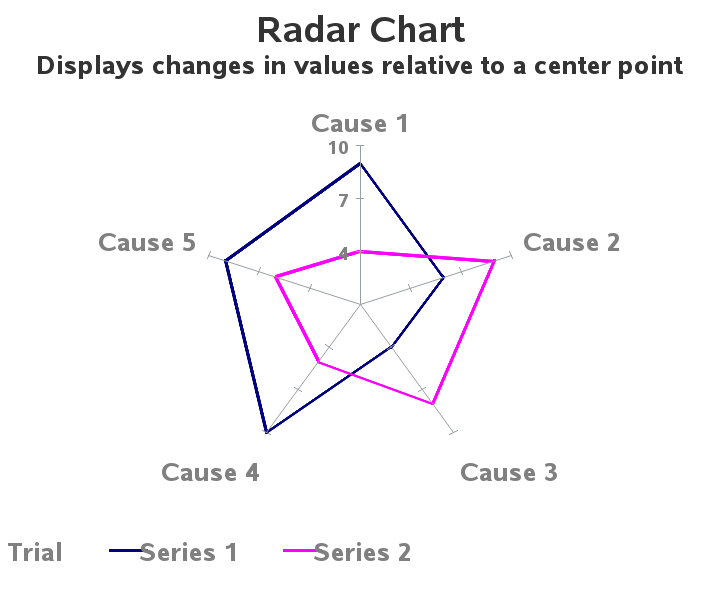
Simple Radar Chart
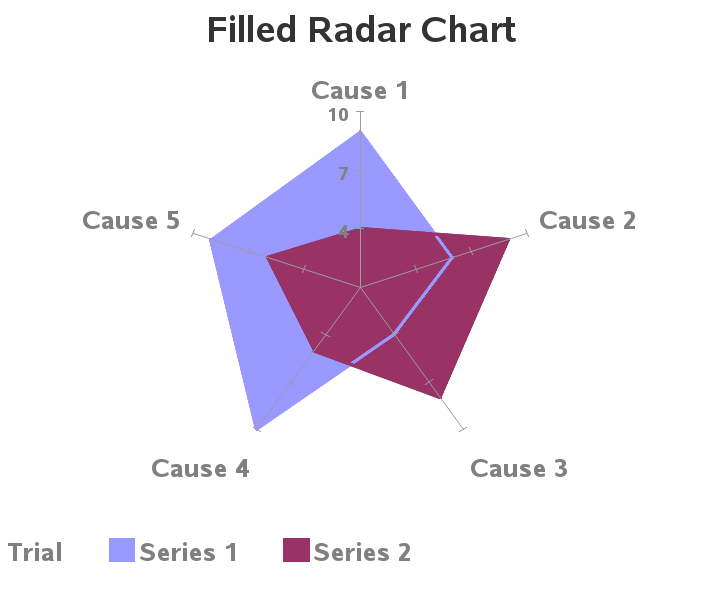
Solid/Filled Radar Chart
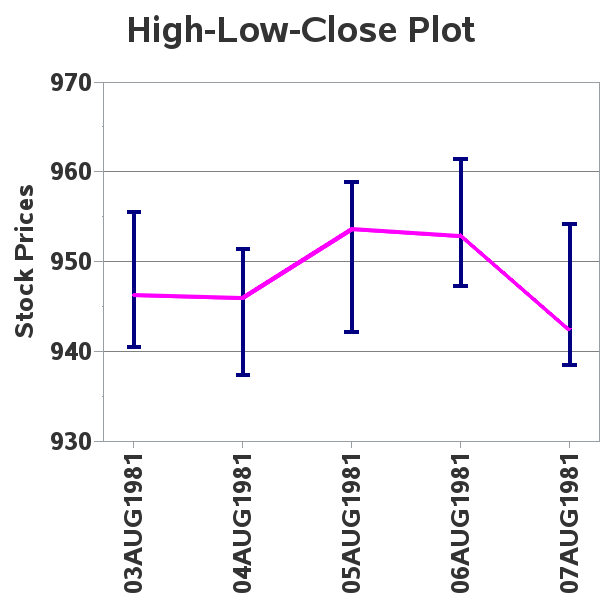
High-Low-Close Plot
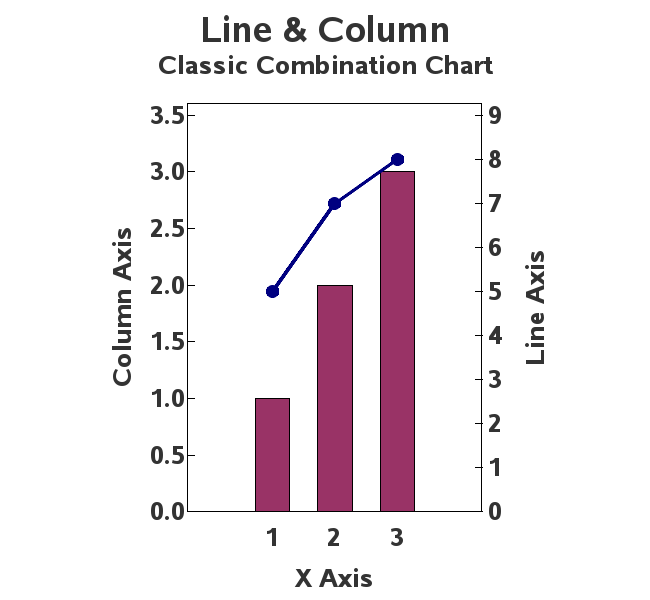
Line & Column
These samples courtesy of Robert Allison
Please see the following README