Click here to see the SAS code.
Click here to see the example.
---------------------------------------------------------------
See my blog for more information about this graph!
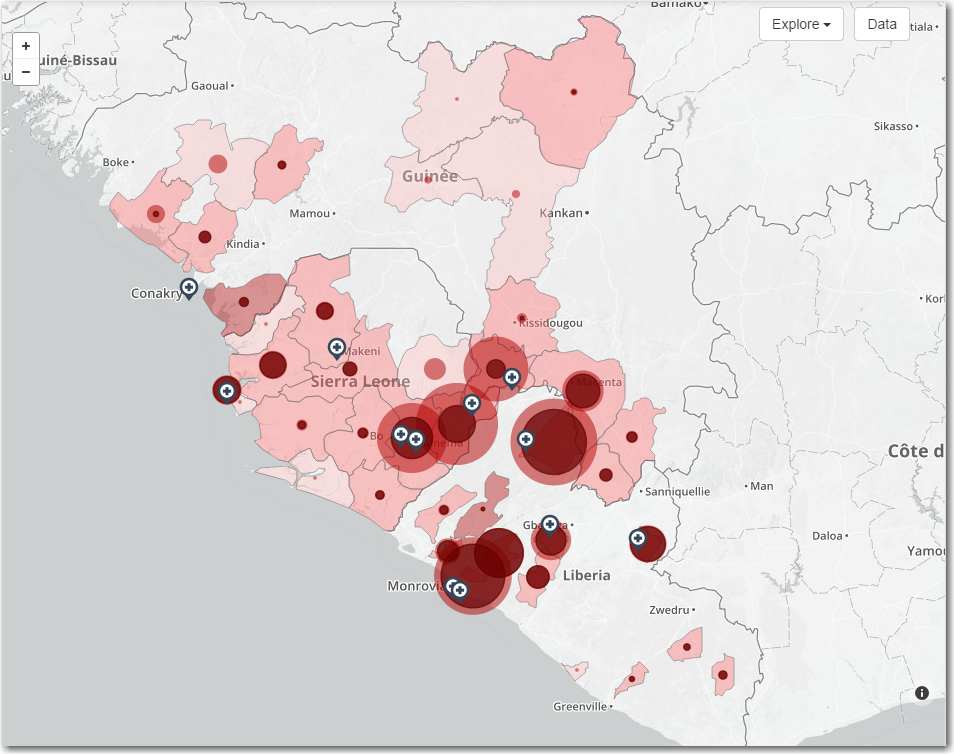
In this map, I use Proc Gproject to 'clip' the rectangular
region of interest (rather than just subsetting by country).
Also, for the countries with Ebola data, I show the internal
area borders (in addition to the country borders) - I use both
coutline and cempty so I can have 2 different border colors for
these internal boundaries. I annotate the country borders.
Note that there is a *lot* of custom annotation going on in
this example. The custom markers, the city names, and the
marker-legends.
-----
Here is the original map I was imitating - I tried to improve it a little
by using totally different colors for the land and the bubbles, and not
using transparent colors (although they let you see the borders behind
the bubbles, when the transparent colors mix, they can produce deceptive
shades of the colors):
 Back to Samples Index