Click here to see the SAS code.
Click here to see the example. (1986)
Click here to see the example. (2016)
---------------------------------------------------------------
See my blog for more information about this graph!
------
Here's a screen-capture of a portion of the 1986 & 2016
ozone chart, for easy comparison:
1986:
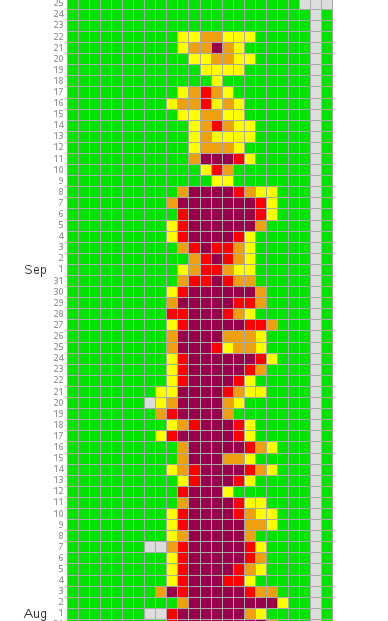 2016:
2016:
 Back to Samples Index