Robert Allison, SAS Institute Inc, Robert.Allison@sas.com
SAS Software
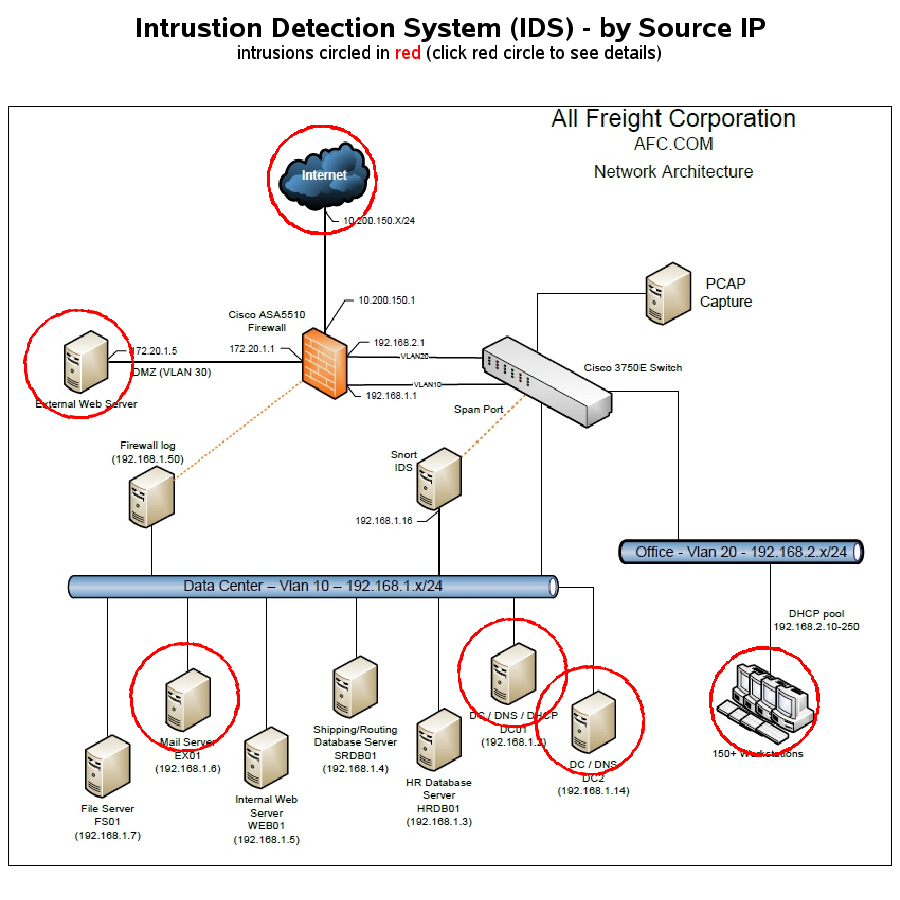
For the "Situational Awareness Interface" I decided to go with a display that everyone was already familiar with - the image of the network layout. I wrote code that analyzed the logs, and hilighted areas (computers) of concern on the network layout image. The user can click the red circle to see the details.
Intrusion Detection Systems (IDS) log:
The screen-capture below represents a summary of the IDS Logs, by Source IP. I expected the source of most intrusions to be the external web, but many were from other computers on the internal network. In the interactive web page (but not the screen-capture below), users can click on the red circles to see the details in tabular form.
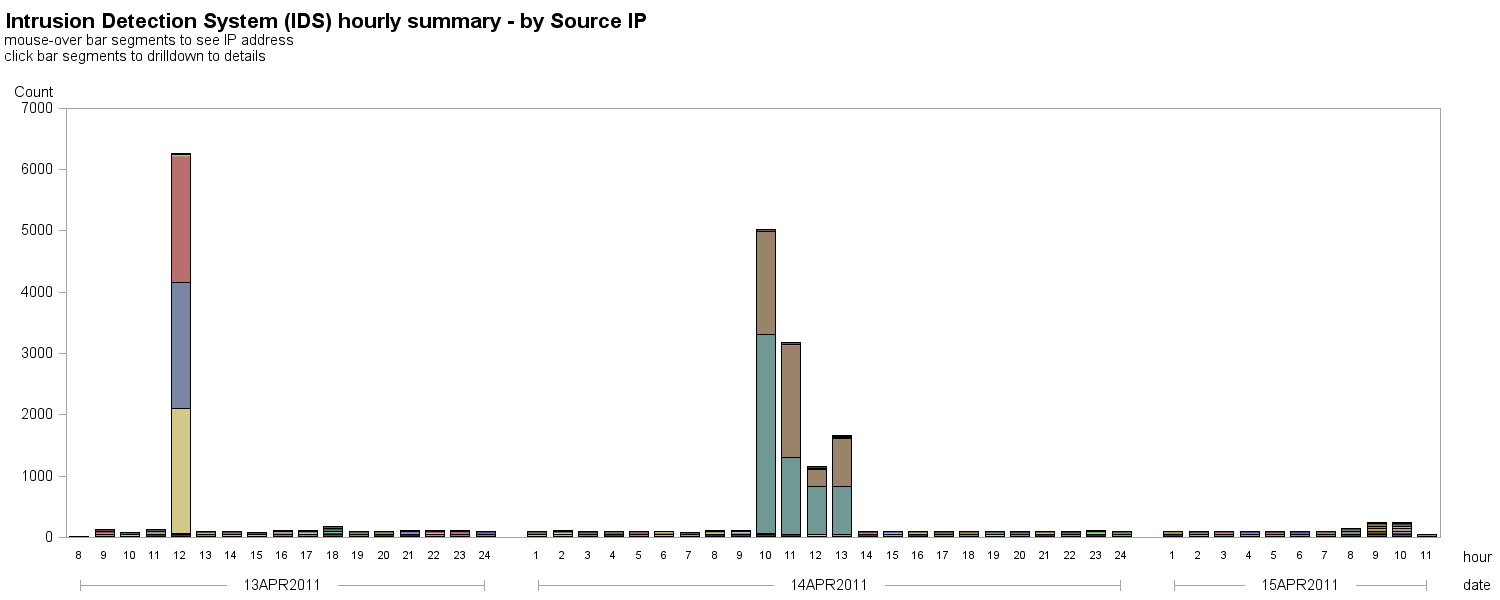
Here is a graph showing when these intrusions happened (each bar represents an hour), and the bar segments are color-coded by the IP address. The clumps of tall bars represent thousands of events, and are probably hacker attacks over a sustained amount of time: The tall bars are mainly from IP addresses 192.168.2.171-175, which are workstations in offices. I investigated the details for several, and found many were Portscans (An attack that sends client requests to a range of server port addresses on a host, with the goal of finding an active port and exploiting a known vulnerability of that service) and Portsweeps (scan multiple hosts for a specific listening port). For example, the tan-colored bar segment in the first tall bar is from IP address 192.168.2.171, and has Portscans and Portsweeps.
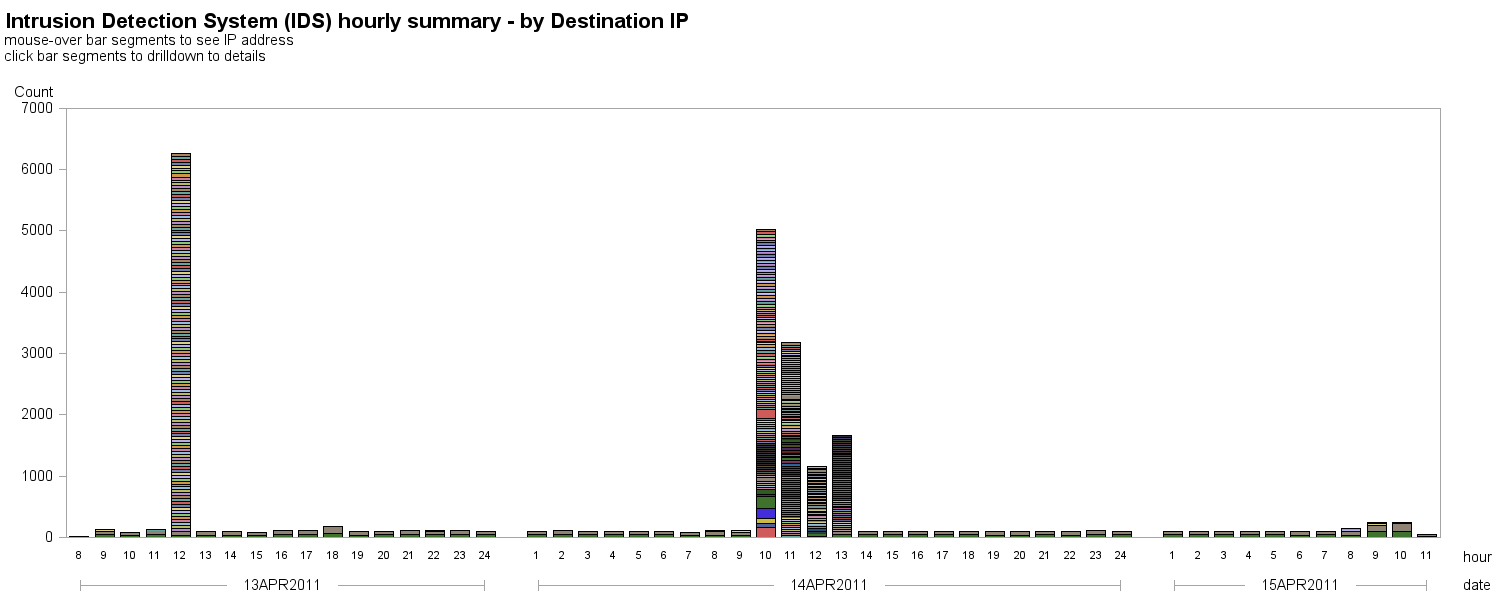
A similar plot of intrusions, colored by destination IP address (rather than source IP address) shows that *many* different machines were the destination of these probable attacks:
Firewall Logs
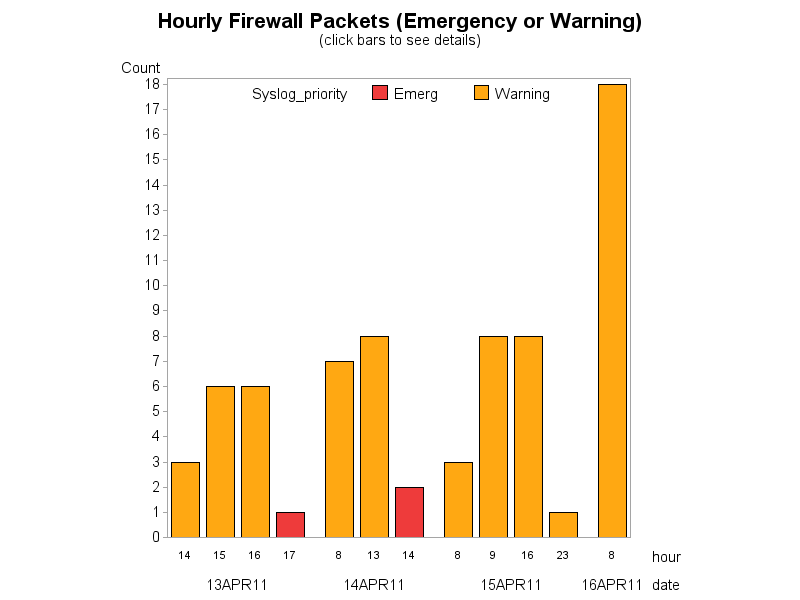
For the packets tracked in the firewall log, I decided to focus on the 'Emergency' and 'Warning' packets. This plot shows an hourly count of those (leaving out the hours that don't contain any, to reduce clutter). In the live web version (not the screen capture), you can click on the bar segments to see the details in tabular form:
The red bar segments, representing 3 messages, are all on machine 172.20.1.5 (external web server), and all originated from the same machine on the external Internet 10.200.150.20. This message "ASA-session-0-106100" is generated any time that a packet is seen that does not match an existing connection on the security appliance. These are of particular interest, because they're the only ones that originated on the external web Internet.
Operating System Syslogs
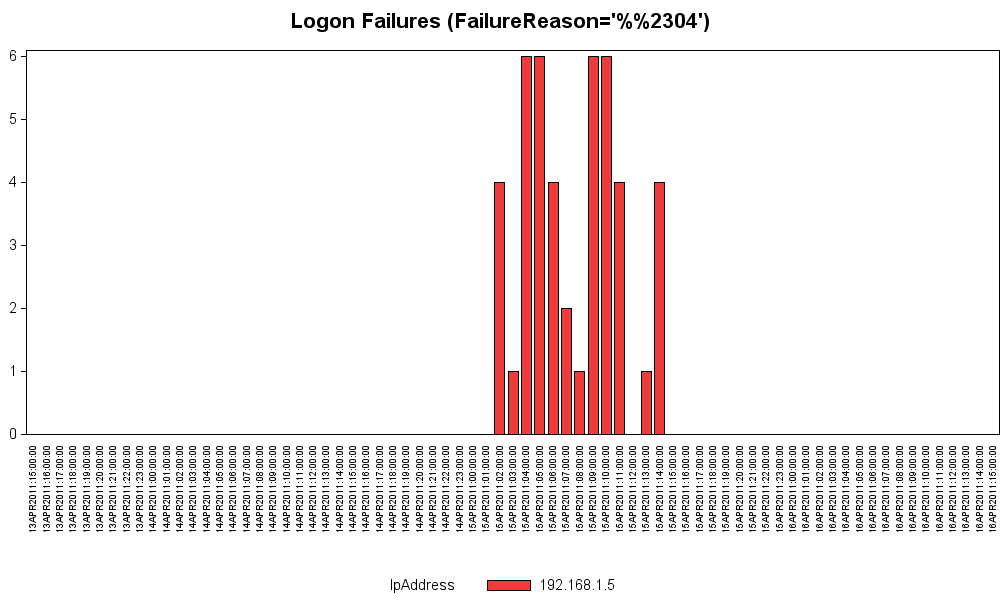
For these logs, the most interesting/urgent messages I noticed were the Login Failures. Repeated login failures frequently indicate that someone is trying to break into a system. All these failures were all on the same machine (192.168.1.5), which is the Inernal Web Server:
Batch jobs could be set up to read these log files on a periodic basis (as often as you determine is prudent, such as every hour or perhaps every 15 minutes), and threshold values could be determined for the maximum number of each type of message to allow before sending an email to the CNO. Therefore, the detection/alerting mechanism could be almost instantaneous/real-time ... but based on the number of messages, this level of alerting would probably flood the CNO.
It appears there were many 'hacking' attempts coming from both the internal network and the external web Internet. First & foremost, it would probably be prudent to beef up the firewall to disallow attempts from people on the external web Internet trying to login to the web server. Next, all the machines on the internal network (especially the workstations in the offices) should be scanned for viruses and trojans.