The Literature review begins with computer technology, then covers data analysis techniques, and last describes how the two can be used together to study textile and apparel-related data.
The first section contains an overview of historical uses of electronic data processing (EDP) in the textile and apparel industry (Section 2.1). The computer and textile industries have always had strong ties, borrowing technologies from one another to enable revolutions in their own fields. For example, the Jacquard loom's punched card concept provided a means for early computers to store data and programs, and later computer technology provided a means to automate much of the textile and apparel machinery.
The historical overview is followed by two sections describing first the current computer technologies utilized in this research (Section 2.2), and then the applicable data analysis technologies (Section 2.3), including tables, graphical plots, geographical maps, regression, and neural nets.
Next, the major textile- and apparel-related econometric and demographic data sources are described (Section 2.4), with the major emphasis on the data which were integrated into the TABIS data warehouse. The section is important because it provides detailed information on the sources of the TABIS data, and also describes several other sources of data that might be available to merge into TABIS in the future.
Section 2.5 is closely related to, and sometimes overlaps, the data sources section. Some of the existing systems which could be used to analyze textile- and apparel-related econometric and demographic data are presented. The capabilities and scope of the existing systems are described, providing a basis for the needs analysis section.
Last, a Need Analysis section (Section 2.6) shows the existing systems to be inadequate, compared to a data warehouse which utilizes the current computers and networking technology.
This section contains examples of how electronic data processing (EDP) has been utilized by the textile and apparel industry in the past. The major emphasis is placed on the early uses of EDP, prior to the proliferation of personal computers in the mid-1980s.
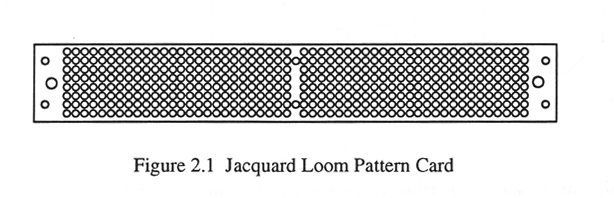
The "EDP Age" was born when Herman Hollerith developed an electrical counting and tabulating machine for the 1890 U.S. census which used punched-cards to store numerical values. But the idea of encoding information as holes in cards was not new -- punched cards had already been used in Jacquard looms for almost 100 years (see Figure 2.1) before Hollerith's invention. [BIT, p. 62] The use of punched cards, which textile firms were already familiar with, probably helped speed the acceptance and use of computers in textiles.
Although Hollerith's punched cards stored information in a similar manner as the jacquard cards, there were several differences. For example, the jacquard cards were larger and their holes were sensed by large mechanical needles, whereas Hollerith's cards were small and the holes were sensed by small wires which completed an electrical circuit by touching mercury. [Lour, p.21]
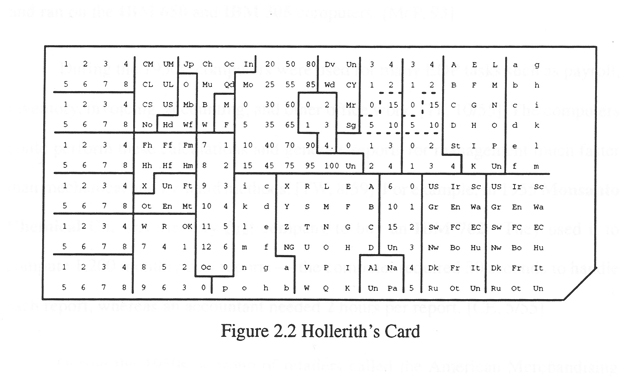
For the 1890 census, Hollerith's cards were blank, which made them difficult to read, but printed cards were introduced by the 1900 census (Figure 2.2). Hollerith's Tabulating Machine Company merged with three other outfits in 1911 to become the Computing-Tabulating-Recording (CTR) Company, and in 1924 became the International Business Machines Corporation (IBM). [BIT, p.78] [HOT, p.1181]
It is interesting to note that an apparel retailer was one of the first non-government users of Hollerith's system. The Marshall Field & Co. department store in Chicago used Hollerith's system in their accounting and inventory department before the year 1900. [BIT, p.78]
Punched-card calculating machines were commonly used for accounting, inventory and payroll purposes throughout the early 1900s. For example, the American Thread Co. used punched card equipment for sales analysis as far back as 1937. In 1945, Dan River Mills, which was a pioneer among the large textile firms, converted its finished-goods inventory-control records to a punched card system. [TW]
Probably the first use of "modern-day" computers in textile and apparel manufacturing firms was for payroll. The first payroll program was written by IBM, and ran on the IBM 650 and IBM 305 computers. [McP, 93]
During the 1950s, computers were used for many EDP tasks such as payroll, inventory, invoicing, accounting, and other office work. [TF] The computers could perform these calculations and generate reports for management much faster than mechanical and by-hand methods. [TTW] For example, in 1955 Monsanto Chemical Co. was the very first company to buy an IBM 702 . They used it to compute 1,200 monthly cost reports -- the computer required 30 seconds to handle each report, whereas an accountant needed 2 hours per report. [CE]
During the 1950s, a group of retailers called the American Merchandising Corporation joined forces to study EDP. Their study started with a large RCA Bizmac computer which they located at Higbee Department Store in Cleveland, Ohio. Mike Zappia convinced Burdine's Department Store management to use a Royal McBee LGP-30 computer for their sales audit application. They replaced their existing cash registers with registers that produced punched paper tape in addition to the sales tickets. At the end of the day, the tapes were read into the LGP-30, and sales reports by sales person, class, department, etc. were calculated. The computer also performed error-checking. [CA, 8/58]
During the same period, a British knitwear firm began using a computer for production planning and control. Their computer was a DEUCE (Digital Electronic Universal Computing Engine) made by the English Electric Co. [HTJ, 5/57] The DEUCE was designed after the National Physical Laboratory's Pilot ACE (Automatic Computing Engine) [BIT, p.147], and was one of the first computers sold in England. [HOT, p. 1202]
In 1956, Cone Mills installed an IBM 650 which they used for 23 jobs. The 650 is a medium-sized computer which is smaller than IBM's 700-series machines. The 23 functions included: payrolls, quality control, packed stock inventory, dye cost analysis, supply reports, labor cost analysis, weaver efficiency reports, retirement plan reports, accident frequency reports, fabrics cost reports, standard fabric printing cost, stockholders' dividends, and several others. [TI, 3/59]
In September 1957, the first meeting of the Textile Data Processing Association (TDPA) was held at Celanese Corp. of America in Charlotte, NC. During this time period, John Temple, the textile industry representative for IBM's data processing division, noted that although EDP equipment had originally been sold to textile manufacturers mainly as a time-saver in various accounting operation, it was now being sold increasingly as a management tool which could help mill executives run their business. The members of the TDPA used several different hardware platforms at their mills, including: UNIVAC at Cannon Mills; IBM 650 RAMAC (Random Access Method of Accounting and Control) at Dan Rivers, Greenwood Mills, and American Thread Company; and IBM 305 RAMAC at Chatham Mfg. Co. [MBA, 3/60]
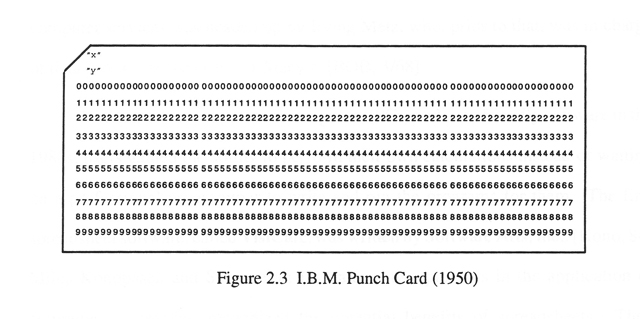
The American Thread Company (ATCO) utilized computer cards (Figure 2.3) to provide their customers with an easy means of re-ordering. Each box of goods they shipped contained an IBM card that was pre-punched to represent the item number, quantity, size and color contained in the box. When mailed to an ATCO branch, the card represented a re-order for that merchandise. [MBA, 3/60]
Although IBM computers dominated the EDP computer field, there were several competitors. For example, Elliott Brothers Ltd., which marketed its business computers through the National Cash Register Company, claimed to have produced Britain's top selling electronic computer in 1963 -- the National-Elliott 803. Hepworths Ltd., Britain's oldest and largest independent firm of multiple tailors, ordered an 803 to keep accounts for subscription term customers, and to keep track of inventory held by each of the firm's branches. [TMC]
Several generations of computers installed at Bobbie Brooks' headquarters in Cleveland were the key to operating "one of the country's most highly automated distribution center operations," and their management information systems (MIS) were "the most comprehensive in the apparel industry". In 1968, Bobbie Brooks was using various computers, including: IBM 360 Model 20, IBM 1410-1460, Honeywell 1200, and an IBM 1130 with a digitizer and plotter for computer grading and graphic presentation. During the 1960s, their management information and computer services was headed up by Irving Metz, who, prior to that, was in charge of data processing services for Macy's. [BOB]
With the advent of personal computers (PCs) and user-friendly software in the 1980s, users gained the ability to perform their own calculations instead of waiting on a professional programmer to write and run the programs for them. The first spreadsheet software, called VisiCalc, was written by Software Arts, Inc.. [Kono, 84] Milos Konopasek and Sundaresan Jayaraman, two pioneers in the application of computers to textiles, recognized the potential benefits of spreadsheets. They proposed several uses of VisiCalc for "computer assistance in problem solving and decision making" in textiles. [Grady, 83, ch. 11]
TK!Solver was another of the early PC productivity tools which required no programming. The software is basically a "toolkit" for solving equations. It allows the user to enter mathematical equations, and set values for any of the variables in the equations. The equations are then solved using either the Direct or Iterative Solver. TK!Solver runs on both PC's and Unix workstations, and has a large user-base, including textile engineers at Georgia Tech and the NCSU College of Textiles. Konopasek and Jayaraman were two of the creators of this product, and wrote a book on using TK!Solver for problem-solving in science, engineering, business, and education. [Kono, 84]
As these examples show, the textile industry has historically been among the first to utilize the latest computer technology. Hopefully, this research will help maintain that image as we enter the "information age" of powerful desktop computers and high-bandwidth networks.
This section describes some of the current computer technologies which have made data warehousing (see Section 2.2.3) and many of the other techniques used in this research possible.
"If automobile manufacturers had improved cars at the same rate as computer manufacturers improved their products, we would be able to drive to the moon using a cup of gas. Conversely, your car would leave you stranded by the roadside at least 3 times a week for no apparent reason."
In many ways today's desktop "personal computers" (PCs) are more powerful than the mainframe computers which were produced 10 or 15 years ago. They have certainly reached a point where they possess enough speed, capacity, and capability to be very useful tools in data analysis.
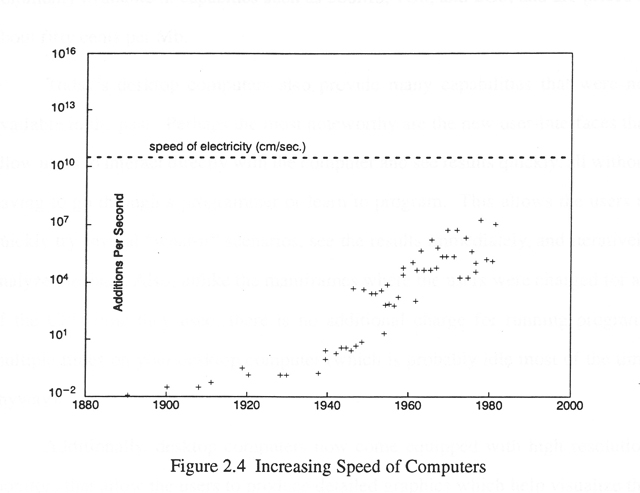
In terms of speed, the new Unix workstations and Pentium PCs have very fast CPUs. For example, some of the new Unix workstations operate at over 100 MIPS (million instructions per second). The following plot (Figure 2.4) shows the phenomenal increases in computing speed over the past few decades. As a point of interest, the plot also shows that this rate of increase might reach a limit in the near future (eg, the amount of time needed by signals moving at the speed of electricity to travel 1 centimeter). [Walker, p.74]
In addition to high speed, today's computers also have the capacity to handle very large data sets, and perform complex calculations and queries in a timely manner. For example, desktop Unix workstations are commonly configured with 16Mb to 48Mb of RAM (Random Access Memory), and some can be configured with over 100Mb. Also, a portion of the disk drive is allocated to serve as swap space (i.e., "virtual RAM"), easily doubling or tripling the amount of effective RAM.
Whereas, in the past, large data sets were stored on tape or punched cards, and had to be read into the computer each time a query was run, large datasets can now be stored "on-line" so the users have direct, immediate access. The disk drives are commonly available in capacities such as 500Mb, 1Gb, and 2Gb, and are priced at about fifty U.S. cents per Mb.
Today's desktop computers also provide many capabilities that were not available in the past. Perhaps the most noteworthy are the new user-interfaces that allow users to interact directly with the computer and see results quickly, all without having to go through a programmer or learn to program. This allows the users to quickly try several "what-if" scenarios, see the results immediately, and iteratively analyze the data. Also, unlike the mainframes where the users were charged for all of the CPU time they used, there is no additional charge for running programs multiple times on your desktop computer (which is probably idle most of the time anyway).
Additionally, desktop computers now come equipped with high resolution monitors that allow the users to produce detailed graphics which help visualize the data. Also, new software can utilize the high resolution graphics and allow the users to analyze the spatial and temporal aspects of the data with features such as three dimensional rotating plots and animations.
Networking is a key "enabling technology" for this research. Note that every networking capability described in this section was directly utilized in constructing and/or using TABIS.
During the 1970's and early 1980's, most desktop computers operated as "islands of computing" which were not connected to any other computers or resources. Therefore, each computer could only access the software, files, and hardware that were directly connected, and access to more powerful computers (eg, mainframes) was accomplished through terminals or dial-up sessions that generally only provided ASCII character capabilities through slow connections (such as 2400 baud dial-up).
Today's networking technologies, such as LANs (Local Area Networks) and WANs (Wide Area Networks), have made resource sharing a reality. For example, software and data can be installed on a file server, and all users have access to it immediately. Similarly, peripherals such as printers can also be shared. The cpu power can even be shared through remote logins on high-speed networks, making distributed processing a reality, often with full graphical input and output capabilities.
The computers used in this research are connected to the Internet, the largest and most popular computer network in the world. The Internet grew from an experimental prototype resulting from the Advanced Research Projects Agency (ARPA) research to interconnect LAN's and WAN's. The Internet allows different networks from all over the world to communicate using "The TCP/IP Internet Protocol Suite." [Comer]
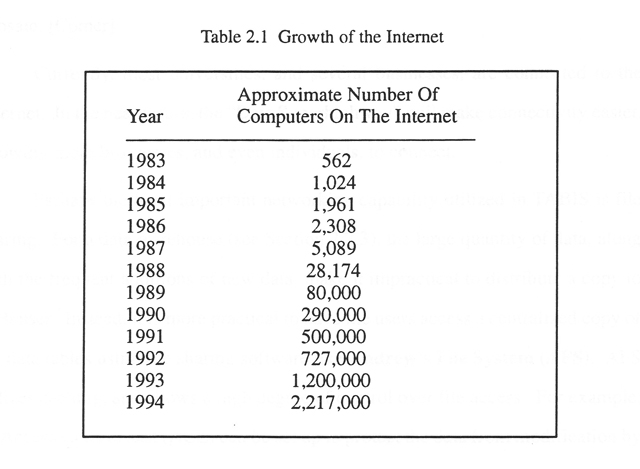
The Internet has experienced exponential growth, more than doubling in size each year. It has grown from a few hundred computers in 1983 to over two million computers today (see Table 2.1). [Comer]
The enormous popularity of the Internet is due, in part, to the variety of services it provides. For example, electronic mail (e-mail) allows users on the Internet to communicate around the world instantaneously. Electronic Bulletin Board Services (BBS) allow users to post questions (and other information) in a form that everyone on the Internet can both read and respond to. The File Transfer Protocol (FTP) allows users to transfer files (data, source code, and compiled executables) between computers connected to the Internet. The Telnet program allows users to perform Remote Logins to other computers connected to the Internet -- the users can then run software on the remote computers, and even see graphical results if a windowing system like X-Windows is used. A recent development, known as the World Wide Web (WWW), allows Internet users to browse hypertext documents containing text, graphics, and audio from around the world using browsers such as Mosaic. [Comer]
Currently, most universities, and several businesses, are connected to the Internet. In the near future, the "Data Superhighway)" will make connectivity easier, allowing more businesses, and even individuals, to connect.
Perhaps the most important networking capability utilized in TABIS is file sharing. For a data warehouse (see Section 2.2.3), the large quantity of data, along with the frequent additions of new data, make it impractical to distribute a copy to each user. Instead, it is more practical to have the users access a centralized copy of the data tables using file sharing software like Andrew's File System (AFS). AFS utilizes caching, and allows a high degree of control over file access. For example, an Access Control List (ACL) can be set up to protect the data from modification by the general user population, while allowing fellow researchers write permission in directories where they are helping construct the data base. Unlike most file systems, AFS can even allow access from computers around the world.
In addition to file sharing, users can also utilize the shared peripherals that are attached to the network. For example, a high quality plotter in another building might be used to print a detailed demographic map which was generated at the user's desktop. Also, various sizes and formats of tape drives connected to the network can be used to load data into a data base. Virtually any peripheral on any computer connected to a network has the potential for being shared, either directly or indirectly.
Distributed processing is an important concept in data warehousing. Unlike in the past, when all data base activities were performed on a mainframe, today's desktop computers are powerful enough to run the jobs, using the network to access the data. When needed, the users can also remotely login to more powerful computers across the network, and display the graphics on their desktop computer using X Windows software. Recent networking software even allows X Windows graphics to be displayed over a "slow" dial-in connection using software such as Serial Line Internet Protocol (SL/IP), or Linux.
Data warehousing is a concept recently made plausible by inexpensive on-line data storage, networking, powerful desktop computers, and software that empowers users to query and analyze the data. Although there is no "official" definition of a data warehouse, the following excerpt describes several key characteristics:
"The data warehouse has two basic characteristics -- the first is that a data warehouse is integrated and the second is that a data warehouse contains a long time horizon of data ..."
"The integration of the data warehouse implies the warehouse draws its data from a disparate collection of unintegrated legacy applications. As the data enters the data warehouse it is transformed into an integrated structure and format. The transformation process involves conversion, summarization, filtering, and condensation of data (in the simplest of cases)."
"The lengthy time horizon of data in the warehouse necessitates that the technology surrounding the warehouse be able to hold and manage large volumes of data. Another consideration of the time-variant orientation of warehouse data is that the internal key structure of the data warehouse must contain some form of date." [Inmon]
As this research involves collecting time-series data from various disparate and unintegrated sources, and integrating them into a coherent system, it definitely falls into the category of data warehousing.
All of the disparate econometric and demographic data integrated into the data warehouse were received in the form of two-dimensional tables, and therefore a Relational Database (RDB) structure was chosen as a convenient means to store the tables, allowing the tables to be integrated with the Structured Query Language (SQL). The remainder of this section provides a basic overview of the RDB technology.
E.F. Codd, an IBM researcher, developed the "Relational Model of Data for Large Shared Data Banks" over 35 years ago to "protect users of large data banks from having to know how the data is organized in the computer." [Codd, p.377] RDBs are built on the fundamental concepts of "relational algebra". Codd's original operators included: restrict (or select), project, product, union, intersect, difference, join, and divide. [Date, pp.295-297]
Relational theory was first implemented at IBM in a prototype product called System R, and later evolved into commercial IBM products, such as DB2. [SAS_SQL, p.3] Codd's model has been adopted as the basis for the Relational Database Management Systems (RDBMS) which are prevalent today.
SQL is the structured query language used to retrieve and update data in relational database tables. SQL is now in the public domain and is part of many vendors' products (eg. Oracle, Sybase, Ingres, dBase, SAS, and many others). [SAS_SQL, p.3]
Other database systems such as object-oriented, network, and hierarchical were considered, but could not provide the convenience and functionality of the relational system for the simple table-oriented needs of this research. [Codd] [Date]
This section describes several of the data analysis techniques which could be used to analyze the types of data stored in the TABIS data warehouse. Most of the techniques have actually been applied, and the others could be applied to the data in the future, using the framework provided by TABIS.
For detailed information on the application of these techniques, see the "Results" and "Recommendations for Future Work" sections.
A table is data, and possibly other information, arranged in rows and columns. Even the simplest data analysis software, such as spreadsheets, can produce tables.
The ordering, arrangement, and grouping of the data often enhance the usefulness of a table. Also, calculated values such as totals and basic statistics (mean, mode, median, standard deviation, and percentages) are essential in summarizing large amounts of data. Tables are often used in conjunction with other analysis methods to provide the actual values of data, such as outliers, shown to be "interesting" in plots or maps.
Graphical data analysis techniques allow one to visualize large quantities of data, and identify trends and characteristics, without the need to examine individual values. They also provide a quick and simple means of comparing data at a glance. [Schmid, p.2]
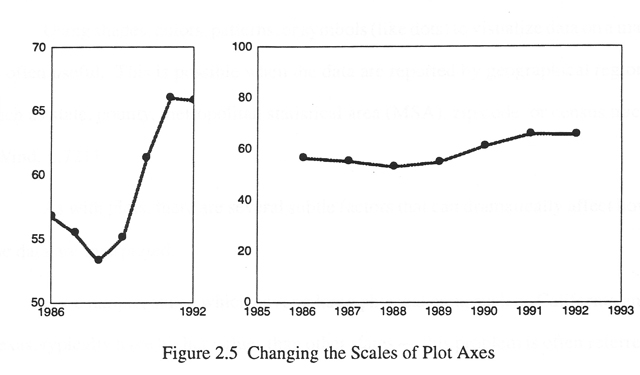
A simple plot, or rectilinear coordinate line chart, is perhaps the single most useful form of graphical data analysis, [ETS1, p.13] but there are many factors which must be considered to construct a useful plot. For example, the scales and proportions of the horizontal and vertical axes of a plot can play a major role in the interpretation (or mis-interpretation) of the data. In general, it is best to start with scales which cover the entire range of possible values -- this would include zero for most values of quantity. Then, if more detail is needed, another plot can be used to "zoom in" on the area of interest, or a break can be used in the vertical axis scales. [Schmid, p.17]
Also, a proper height to width ratio must be used to produce a well-proportioned chart that does not exaggerate or minimize variations. For example, virtually "flat" data can appear to show drastic increases, or "increasing" data can appear virtually flat, as shown in Figure 2.5, depending on the scales used. [Schmid, p.19] Scales are often mis-used by those who wish to "lie" with the data.
Using shades, colors, patterns, or symbols (like dots) to visualize data on a map is often useful. This is possible when the data are reported by geographical region, such as state, county, metropolitan statistical area (MSA), zip code, or census tract. [Wind, p.721]
As with plots, there are several subtle factors that can dramatically affect how the data are interpreted.
For example, states which cover a large physical area, such as California and Texas, typically have higher values than other states -- this problem is often referred to as area bias. [Haem, p.19] Similarly, comparing geographical regions with different population densities can also be biased. For example, some large states in the mid-west have very small populations, and some small states in the eastern US have relatively large populations.
In such cases, it is often useful to convert values into per-square-mile or per-capita before mapping them. [Meil, p.91] Other useful statistical conversions include rates, ratios, and percentages. [Schmid, p.111] As a general rule, it is best to map data in several different ways to get a more complete picture.
The "art" of forecasting has existed, in one form or another, for many years, as indicated by the following excerpt: [Arm, p.585]
In ancient Rome (A.D. 357), the Emperor Constantius made a law forbidding "anyone to consult a soothsayer, a mathematician, or a forecaster ... may curiosity to foretell the future be silenced forever." Theodosian Code, Book 9, Title 16, Section 4
This section describes some of the regression techniques which can be used to analyze historical data in order to predict future values, such as demand, based on the assumption that the past will repeat. [DeL, p.39]
Numerical data analysis techniques, such as regression, have several advantages over the graphical techniques. For example, they are generally more objective, and can be performed programmatically, without the need for visual interpretation. [DeL, p.63]
Linear regression models are often used to produce simple forecasts of future values. With linear regression models, a value of the dependent variable (eg, apparel sales) can be calculated for any value of the independent variable (eg, year). [McD, p.93] This is referred to as regressing sales on year. [Madd, p.79]
Linear regression models, however, might not be the most appropriate for economic time series data. To meet the requirements needed to produce a valid linear regression estimate, each observation should be totally independent of any other observation -- time series do not usually meet this condition since almost any observation in the series may be forecast by the previous observation plus or minus a small change. Also, because of the autocorrelation (or serial correlation) in time series data, linear regressions produce underestimates of the true variance, and the confidence intervals will be set too narrow. [Chish, p.123] [Sur, p.54] [Pind, p.258] [ETS1, p.6] [ETS2, p.68]
Autoregressive (AR) models are a class of models that can be used to estimate the stochastic process underlying a time series, where the time series values exhibit nonzero autocorrelation. The AR models are the most popular of the three types used in the Box-Jenkins approach -- the other two models are moving average (MA) and mixed (ARMA). [ETS1, p.4] The SAS System's PROC AUTOREG offers the following four estimation methods for the AR error model (via the METHOD= option of the MODEL statement): Yule-Walker (YW), iterative Yule-Walker (ITYW), unconditional least squares (ULS), and maximum likelihood (ML). [ETS, p.213]
A potential difficulty in using any of the regression techniques on economic time series data is that the data are often not stationary. Non-stationary data may exhibit any or all of the following components: a systematic change in mean (i.e., trend), a systematic change in variance, or a seasonal or periodic variation. [ETS, p.7] [Bat, p.155] Mathematical transformations should be performed on such data prior to applying regression techniques.
The surest way to get better forecasts is to make the data forecastable. Corollary: Any knucklehead can forecast a straight line. [Gill, p.298]
For example, monetary values often show an upward trend because of inflation, and are commonly deflated before forecasting is done. The log ut is often used, but there is no guarantee that the logarithmic transformation is the best for the purpose of prediction. [Bat, p.155] [ETS, p.27] The U.S. Department of Labor, Bureau of Labor Statistics (BLS) Consumer Price Index (CPI) provides deflators which can be used to convert current dollars into constant dollar values instead of the log transformation [Kumar, p.38]. The CPI provides average indexes for about 350 consumer items and groups of items. In addition, over 100 of the indexes are available as seasonally adjusted values. [CPI] Some data sets, such as the Bureau of Economic Analysis (BEA) National Income and Product Account (NIPA), provide their own deflators. [PCE]
Time series data can also show upward trends because of increases in the population. Such data can be converted to per-capita values (i.e. dollars or units per person). [Arm, p.148]
Often, monthly textile and apparel data exhibit seasonal trends such as sales increases during back-to-school and Christmas months. These seasonal trends can be eliminated by seasonally adjusting the data -- the seasonally adjusted values are easier to forecast, and can be used to help identify non-seasonal elements. [Arm, p.148] [ETS1, p.129]
A very simple form of seasonally adjusting the data could involve averaging all January figures, all February figures, etc., and then dividing by (or alternatively subtracting) this seasonal factor. [Bat, p.156]
Some data sets, such as the Monthly Retail Sales and Inventories (MRSI), already contain seasonally adjusted values. The seasonal factors for adjusting these data were derived using the X-11 ARIMA program developed by Statistics Canada. The program produces factors by using the method described in the X-11 Variant of the Census method II Seasonal Adjustment Program, U.S. Bureau of the Census Technical Paper No. 15, Revised 1967. [MRSI] A detailed description of the method can be found in Lawrence Salzman's Computerized Economic Analysis [Salz. pp.223-231], and additional information can be found in Seasonal Adjustment on Electronic Computer [SAOEC, pp.356-359] and SAS/ETS Software: Applications Guide 1 [ETS1, pp.129-148]
A recent development in forecasting is the proposed use of neural networks (NNs). [Chat, p.1] NNs might be particularly useful in forecasting a time series that is influenced by several other time series. Although NNs were not utilized in the TABIS research, they are described here because two of the analysis systems described in Section 2.5 use them, and NNs are proposed as an area of further work for TABIS in Section 7.
NNs, named after connections in the brain, are model-free, nonlinear, multivariate, dynamic systems that learn from examples the relationships between inputs and outputs, and can then make decisions in new situations. [Debo, pp.24,192] [O'Brien] Expert systems can also work with learned rules but cannot adjust to new situations. [O'Brien]
NNs have been used for many tasks such as: computer vision, pattern recognition (such as handwriting), speech recognition, loan application scoring, credit card fraud detection, insurance prospect qualification, signal prediction and forecasting, and stock market forecasting. [Hertz, pp.130-141][Debo] [O'Brien]
Although inspired by studies of the brain, NNs have strong ties to statistics. [Debo, p.5] Many of the NN techniques were originally invented by economists and statisticians, but their potential was not realized at the time. NN techniques were later rediscovered by cognitive scientists and neurobiologists, and their importance to commercial problems was recognized. [Debo, p.3]
NNs have experienced several cycles of enthusiasm and skepticism before reaching their current state of acceptance. One peak was in the 1940s with McCullough and Pitt's seminar work. [Pitts] Another was in the 1960s, with Rosenblatt's perceptron convergence theorem. [Rosen] A third peak was reached in the 1980s, starting with papers by Hopfield [Hop] which stimulated interest in the field, and culminating with the publication of Rumelhart, Hinton and Williams' "Back-Propagation Algorithm" [Rume] for solving the fundamental problem of training neural networks. [Hertz, pp.xvii, 7-8]
The advantage of NNs is that they can be used to find mappings between huge input/output product space, even if the patterns between inputs and outputs are ill defined. [Debo, p.192] In practice, NNs are especially useful in mapping problems which are tolerant of some errors, have lots of example data available, but to which hard and fast rules can not easily be applied. [Prech]
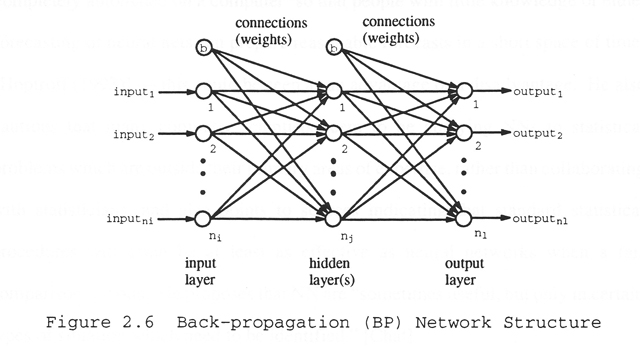
A NN must use a training, or learning, method to map input variables into the range of desired output(s). [Debo, p.192] The most commonly used training method for NN time-series forecasting is back-propagation (BP). [Debo, p.8]
During the training phase, BP sends the input data through the hidden layer(s) to the output layer, determines the error, and back-propagates the error from the output to the input layer (see Figure 2.6). The learning phase minimizes the global error by modifying the weights associated with the links. [Debo, p.24] [Eber, pp.37,43,46]
BP training can be very slow [Debo, p.244], but recent improvements in NN technology and algorithms, combined with advances in desktop computing, have reduced the time needed to solve a problem from days in 1986 to minutes, or at most hours in 1994. [Debo, p.6]
Despite their unique capabilities, there are several drawbacks to forecasting with NN. Because of the complexity and interactions between the hidden nodes of a neural network, it is difficult to understand exactly how a decision is reached. Therefore, managers, traders, and investors must trust the output of the NN blindly. [Debo, p.244] The NN's lack of confidence intervals is another drawback. [Debo,p.193]
Chatfield also raises several points of caution regarding the use of NNs in forecasting. For example, he points out that the NN forecasting process can be completely automated on a computer 'so that people with little knowledge of either forecasting or neural nets can prepare reasonable forecasts in a short space of time' [Hoptroff (1993)] -- this could be seen as an advantage or a disadvantage. He also cautions that many computer scientists seem to be applying NNs to statistical problems which are outside their primary areas of expertise, rather than collaborating with statisticians, and also points to sources indicating that standard statistical procedures will often be at least as effective as neural networks when a fair comparison is made. He proposes that NNs are "sometimes useful, but only in certain types of situations, which need to be identified." [Chat]
There are many NN software systems available, including: Hecht-Nielsen Neurocomputers (HNC); Neil Thall Associates, Inc. (NTA); the PDP simulator (included in the book Explorations in Parallel Distributed Processing); University of Rochester's Connectionist Simulator (RCS); UCLA's SFINX; UCSD/AT&T's SunNet; Mitre Corporation's Aspirin/MIGRAINES; Ward Systems' NeuroShell, NeuroWindows, and NeuroBoard; California Scientific Software's BrainMaker; NeuralWare's NeuralWorks Explorer and Professional II; Cognitive Software's Cognitron; TRW's MarkII; SAIC's ANSim and ANSpec; Nestor's NDS (Nestor Development System); IBM's Computational Network Environment (CONE); Neuralyst, an add-in for Excel from Epic Systems; @Brain, an add-in for Lotus 1-2-3 from Talon; and ModelMAX, from Advanced Software Applications. [NNRG, pp.50-56] [Vem, pp.102-107] [O'Brien, p.48]
In the past, there were few sources of textile- and apparel-related data. The following excerpt describes an early effort (1917) by the War Industries Board to obtain such data:
... in 1917, nobody knew how big the American people were. Even mail-order clothing available from Sears, Roebuck and Company was almost custom-made from measurements of the customer sent along with the order. Most off-the-rack clothing was ill-fitting. If clothing fit a person, it usually meant that the wearer could afford the services of a tailor. In spite of a huge clothing industry, the United States army didn't know how many uniforms of different sizes to order. As a result, they had to measure draftees to get a data base. During World War I, more than a hundred thousand men were measured to get data for sizing uniforms. Twenty-three measurements were taken. ... Hollerith's C-T-R Company sorting and tabulating machines were used to correlate this information into the very first picture of the size and weight of American men. (True to stereotype, Texans were the tallest, Men from Alaska were heaviest. The men from North Dakota had the largest chests.) [Stine, p.73]
In today's "information age", there exist many sources of textile- and apparel-related data. This section describes several of those sources, beginning with generalized lists, and then moving on to more detailed descriptions of specific data sets which were integrated into TABIS.
One of the most comprehensive lists of textile- and apparel-related data is found in the thesis written by Akhil Kumar. In Kumar's "Survey, Classification, and Analysis of Business Statistical Information Sources for the U.S. Textile and Apparel Industries", he describes the information and sources, classifying them as primary, secondary and tertiary data. The thesis contains large fold-out charts which show the flow of data from their original sources. [Kumar]
Kumar also reviews several publication which provide information on other data sources such as: "The Textile Industry: An Information Sourcebook" [Vogal], "Business Information: How to Find It, How to Use It" [Lavin], and "Sources of Statistical Data: Textiles and Apparel." [SSD]
Another excellent reference is "The New Direct Marketing: How to Implement a Profit-Driven Database Marketing Strategy (Second Edition)" by David Shepard Associates. Especially useful is the 150-page appendix of "Vendors of Data and Computer Services" which provides detailed descriptions (including advertisements and sample output) from the following marketing-specific vendors: Claritas Prizm, Database America, Donnelley Marketing Inc., Donnelley Marketing Information Services, Dun's Marketing Database, Equifax National Decision Systems MicroVision, InfoBase, National Demographics & Lifestyles, May & Speh, Metromail, Polk Direct, and Strategic Mapping, Inc.
There also exist numerous "marketing information" companies which provide systems, reports, and related services that could be useful to textiles and apparel marketers. The American Demographics magazine publishes an extensive "Directory of Marketing Information Companies," dividing them into the following categories: demographics, direct marketing, ethnic marketing, international, mapping, marketing research, media, psychographics, services, and software. [AD] [Shep, p.337]
The State Data Centers (SDCs) are another excellent source of data. They provide access to information from the Census Bureau and many other government and private sources. Although not part of the Census bureau, the SDCs are vital partners in disseminating the Census' data. [HT]
The previous section described general sources, and where to look for data -- this section provides detailed descriptions of the specific data sources which were utilized in the TABIS research.
The bureau of the Census maintains several data sets including: Projections of the Population by state, age, sex, and race [Pop]; Monthly Retail Sales and Inventories in department stores and apparel specialty retail stores [MRSI]; Geographic Area monthly sales estimates; Kind-of-Business sales, inventory, and inventory/sales ratios; MA22 & MA23 US Domestic Production Information; and County Business Pattern summaries containing the number of employees and establishments by Standard Industrial Classifications (SIC), including SIC 2200 (textiles) and SIC 2300 (apparel) manufacturing [CBP]
The NPA data set contains key indicators of county growth for the years 1970-2015. Included are projections (down to the county level) for employment, income, earnings per job, number of households, and population by several age groups. [NPA] [AD, p.D3]
The BLS also maintains several useful data sets. One contains the average U.S. household expenditure on line items such as men's, boys', women's, girls', and children's apparel by 69 groupings such as age, income, and area of the U.S. Another tracks the Consumer Price Index (CPI) and Producer Price Index (PPI) which can be used to deflate values for several apparel categories. A third data set contains Employment and Earnings data by Standard Industrial Classification (SIC). Some data are available from the year 1909 through the present.
The BEA data set contains National Income and Product Account (NIPA) Personal Consumption Expenditure (PCE) data by several categories, including women's and girls' clothing, men's and boys' clothing, and infants' clothing, in both current and constant (1987) dollars for the years 1959 to 1992. [PCE]
The AAMA Topline Report data set contains a summary of Kurt-Salmon Associates (KSA) and NPD data for apparel sales of several individual line items to men, women, boys, and girls for the years 1984 to 1991.
This data set contains state totals of Clothing Sales in all stores and department stores, to men and boys, and women and girls for the years 1975 to 1993. The data is based on "Merchandise Line Information" published in the Census of Business, Retail Sales data.
This panel survey is the primary source of data used for most of the apparel product line demand forecasts made using the TABIS data warehouse. NPD provides panel data on total apparel, total jeans, men's slacks, men's tailored clothing, men's underwear, and women's panties by age, type of area (urban/rural), income level, and region of the U.S., in both dollars and units.
The MRCA data set contains panel data on jeans, sweat bottoms and tops, men's suits, men's dress and sport shirts, women's slacks, and boy's shirts, by age and sex, in both dollars and number of units sold.
This section describes several of the existing database and analysis systems that are available to the general public, and that might be used to analyze textile- and apparel-related econometric and demographic data.
Most large apparel retailers also use their own data and analysis systems, but due to their proprietary nature they are not described here.
HNC's Decision Systems group provides a product called SkuPLAN that integrates several technologies, including neural networks (NNs) (see Section 2.3.5), to predict sales for individual Stock Keeping Units (SKU) or any group of SKUs defined by the user, from the level of an individual store to an entire chain. SkuPLAN utilizes point-of-sale, promotional, and demographic data to facilitate production, stocking, purchasing, and promotion decisions.
SkuPLAN attempts to utilize the NN's ability to recognize data patterns -- especially non-linear hidden, and multi-variate patterns -- to extract and model the interdependent relationships from large, complex databases.
SkuPLAN was developed through a strategic partnership between HNC and Neil Thall Associates (NTA). Their customers include Levi Strauss & Co., Vanity Fair, and J.C. Penney. [HNC] [NTA]
NTA is an Atlanta-based consulting firm specializing in advanced inventory management methods for retailers and suppliers. They develop and implement highly advanced Consumer Sales Forecasting and Data Analysis Systems based on neural net (NN) technology.
NTA uses NNs because they believe existing forecasting methods, such as regression models and expert systems, to be inadequate. With expert systems, many problems are so complex that formulating the required rule-base is prohibitive. Regression models take too much time to develop, and are not accurate in dynamic, multi-variable problems such as retail forecasting. Most other forecasting and analysis systems in common usage are based on linear regression with only one variable -- prior sales.
NNs "automate" the analysis of a multitude of information such as prior sales, promotions, industry trends, sales of similar items, competition, and other factors that potentially affect sales. They uncover complex relationships in data and build predictive models based on those relationships (see Section 2.3.5).
Neil Thall, president of NTA, was formerly senior retail partner for Kurt Salmon Associates (KSA). NTA's clients include the most advanced and sophisticated companies in the consumer products retail and manufacturing industry. [NTA]
Lucas-Bear markets a Quick Response stock replenishment system which contains a Demand Forecasting component. They cater to a variety of clients, including several textile and apparel companies (eg. Allied Signal Inc., Burlington House Fabrics, Eddie Haggar Ltd., and Gitano Group Inc.).
Their Demand Forecasting process begins with the transfer of three years of demand history from an order entry system. A series of algorithms are then applied to determine the model with the least amount of forecast error for the next two years. The user is allowed to make adjustments to the recommended forecast based on knowledge of factors such as promotional events, marketing strategy, and new customers. [LB]
Although the AAMA does not produce computer-based forecasting and analysis systems, they provide assistance through several publications. The annual FOCUS publication, which contains an economic profile of the apparel industry, is one example. FOCUS contains numerous tables of data on textile and apparel employment, production, and consumption. [FOCUS]
Also, the AAMA's Management Systems Committee has produced several helpful publications including: "Sales Forecasting in the Apparel Industry", "Electronic Data Interchange in the Apparel Industry," "Using Point-of-Sale Data," and "EDI for Apparel: A Management Overview." [SFA] [EDI_A] [POS] [EDI_MO]
PRIZM is Claritas Inc.'s demographic taxonomy of Americans by postal Zip Codes, Zip-plus-four, and block tracts. For the past 20 years, it has been among marketers' favorite tools for finding consumers. Unlike companies keeping data bases of individuals, PRIZM lumps people into groups. It is founded on the notion that "birds of a feather flock together" -- the idea is that people who live in the same neighborhood tend to buy the same types of things.
The PRIZM projections are based on U.S. Census data, supplemented with market-research surveys and other statistics from suppliers such as A.C. Nielsen Co., and information from 1,600 municipal and regional agencies. Recently, PRIZM added 22 new consumer group categories, bringing the total number of consumer segments to 62. PRIZM is known for its insight, as well as its fanciful names for consumer groups, such as:
"American Dreams": The emerging, upscale, ethnic, big-city mosaic; one in five is foreign born. Lifestyle: Import cars, Elle, Mueslix, tennis weekends, and designer jeans. Income: $46,100.
"Rural Industria": Young families in heartland offices and factories. Lifestyle: Trucks, True Story, Shake'n Bake, fishing trips, and tropical fish. Income: $22,900.
"Cashmere & Country Clubs": Aging baby boomers living the good life in the suburbs. Lifestyle: Mercedes, Golf Digest, salt substitutes, European getaways, and high-end TVs. Income: $68,600.
Although numerous textile- and apparel-related databases and analysis systems already exist, they do not utilize the capabilities of current computer technology, and therefore do not meet the needs of the users.
First and foremost, there is a need for a "data warehouse" system that integrates the existing disparate databases, providing a unified view of the data both between the data bases and over a long time horizon. Most of the existing disparate databases are sold as "closed" systems (usually on CD-ROM), and can only be accessed using the software provided by the vendor. Some other databases are sold in the form of printed or ASCII tables, with no computerized systems at all. Therefore, it is difficult, if not impossible, to integrate the existing databases and analyze data from multiple sources together.
Also, most of the existing systems are based on "old" technology, such as low-power standalone PCs. There is considerable, as yet un-tapped, potential for a system that utilizes the capabilities of powerful new computers and networking technologies.
For example, since the commercial database vendors are motivated to sell multiple copies of their systems, the systems generally can not be shared over a network, and the users must buy a new copy (eg, CD-ROM) each time they want fresh data. Networking technology could allow a central data warehouse to be maintained, and multiple users could then access the latest data via the network and perform distributed processing of the data using their desktop computer.
Also, most of the existing systems only allow users to run "canned" queries that are built into the system. To provide the maximum functionality, the system needs to be extensible, allowing users to add their own data and analysis code.
Output is also very limited on most existing systems. Tables and low-quality "canned" graphics which can only be printed on the local printer are often the only form of output available. There is a need for a flexible system that can produce customizable publication-quality graphics (namely plots and maps) which can be output in a variety of formats suitable for printing on networked devices (such as color printers and 35mm slide cameras) and importing into other software packages (such as word processors and animation software).