---


Robert Allison's SAS/Graph Examples #11


Click on thumbnail to see full-size chart.

Click on label to see explanation and SAS code.


< Previous | Next >


---


PROC GCHART


           Allergy Forecasting                     SUGI Survey Results                        Oil Production                  Images on 3d Bars


---


PROC GPLOT


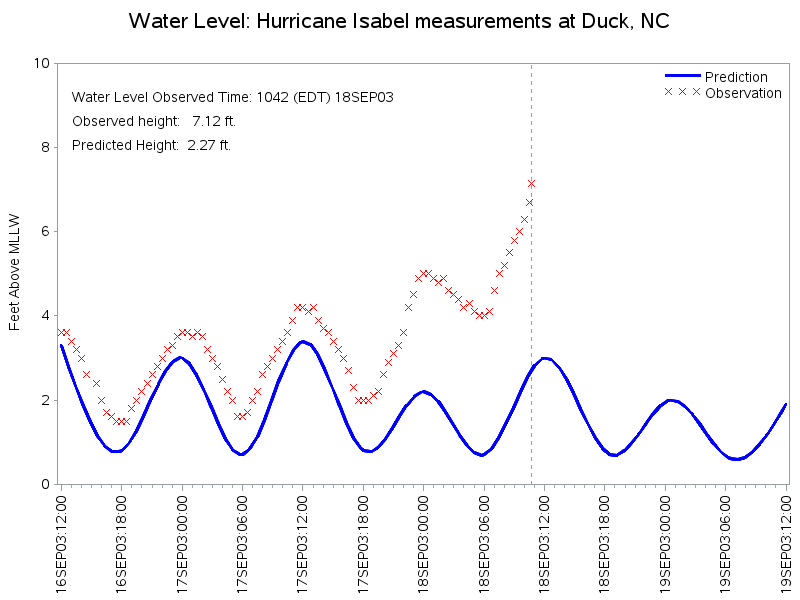
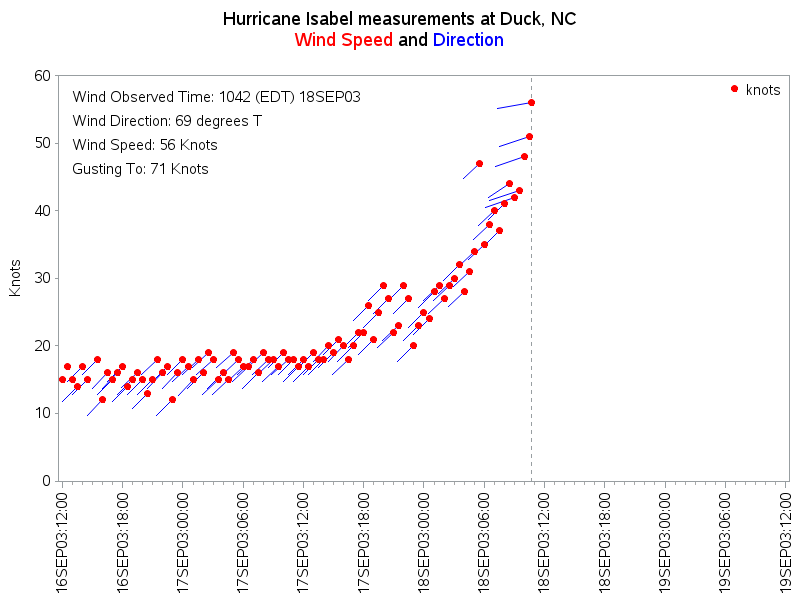
                       Storm Waves                       Multiple Plots Per Page                               Winds


                       Used Corvette Prices                       Genome Analytics                               Forecast


                                  Risk/Loss Forecast                     Commute Comparison                        Poverty Rate Analysis


---


ANNOTATE


                          California Earthquakes                           Koffka Rings                            NESUG Logo


---


PROC GBARLINE


                          Licensed Physicians                           Bioremediation                            Oil Field Production


---


< Previous | Next >

These samples courtesy of Robert Allison

Please see the following disclaimer