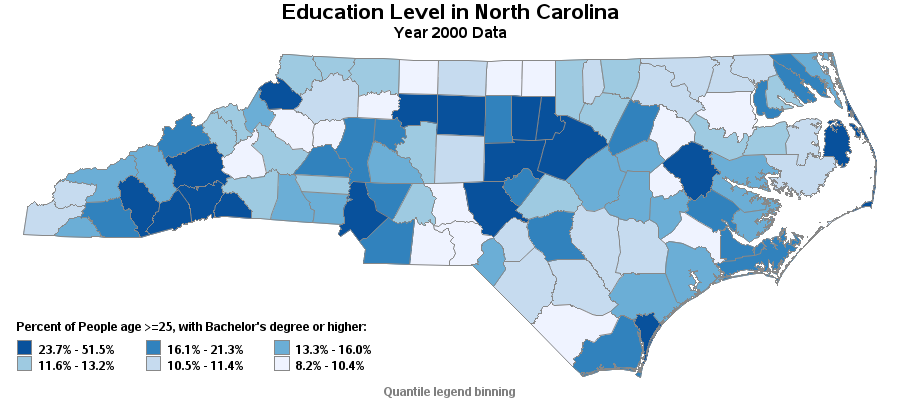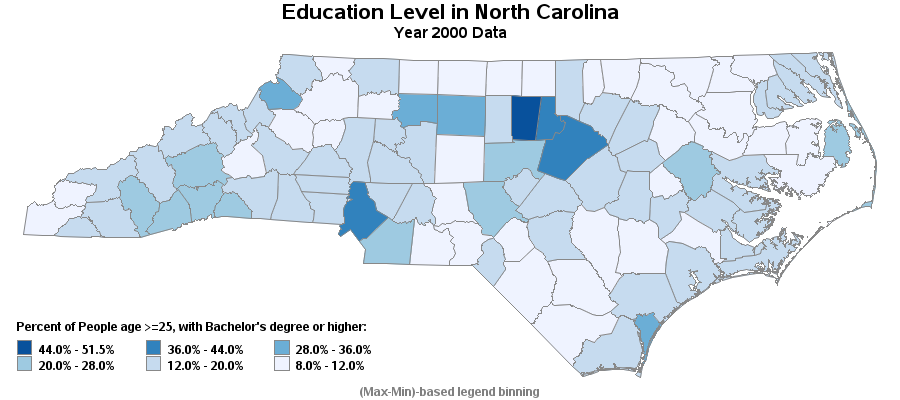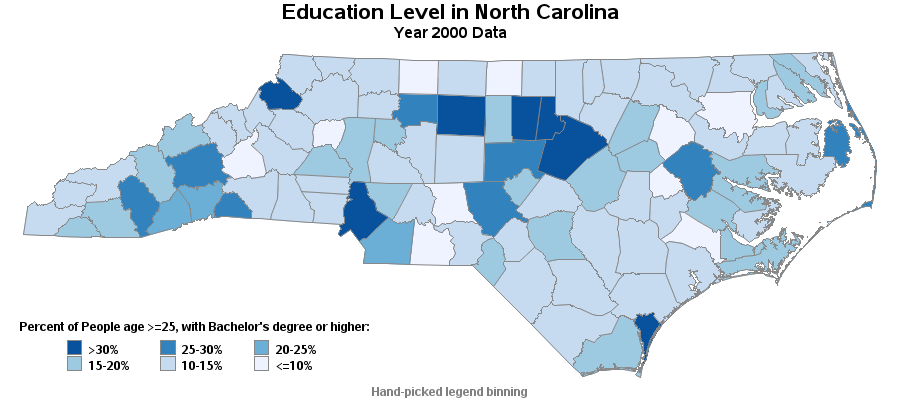
| Education Level in North Carolina |
| Year 2000 Data |
| statecode | county_name | bachelors_degree |
|---|---|---|
| NC | Orange | 51.5% |
| NC | Wake | 43.9% |
| NC | Durham | 40.1% |
| NC | Mecklenburg | 37.1% |
| NC | Watauga | 33.2% |
| NC | New Hanover | 31.0% |
| NC | Guilford | 30.3% |
| NC | Forsyth | 28.7% |
| NC | Dare | 27.7% |
| NC | Chatham | 27.6% |
| NC | Moore | 26.8% |
| NC | Pitt | 26.4% |
| NC | Polk | 25.7% |
| NC | Jackson | 25.5% |
| NC | Buncombe | 25.3% |
| NC | Henderson | 24.1% |
| NC | Transylvania | 23.7% |
| NC | Union | 21.3% |
| NC | Carteret | 19.8% |
| NC | Craven | 19.3% |
| NC | Alamance | 19.2% |
| NC | Cabarrus | 19.1% |
| NC | Cumberland | 19.1% |
| NC | Davie | 17.6% |
| NC | Iredell | 17.4% |
| NC | Lee | 17.2% |
| NC | Nash | 17.2% |
| NC | Catawba | 17.0% |
| NC | Chowan | 16.4% |
| NC | Pasquotank | 16.4% |
| NC | Camden | 16.2% |
| NC | Macon | 16.2% |
| NC | Brunswick | 16.1% |
| NC | Madison | 16.1% |
| NC | Beaufort | 16.0% |
| NC | Haywood | 16.0% |
| NC | Johnston | 15.9% |
| NC | Scotland | 15.9% |
| NC | Clay | 15.4% |
| NC | Wilson | 15.1% |
| NC | Wayne | 15.0% |
| NC | Onslow | 14.8% |
| NC | Pamlico | 14.7% |
| NC | Avery | 14.5% |
| NC | Gaston | 14.2% |
| NC | Rowan | 14.2% |
| NC | Swain | 13.9% |
| NC | Pender | 13.6% |
| NC | Cleveland | 13.3% |
| NC | Currituck | 13.3% |
| NC | Lenoir | 13.3% |
| NC | Franklin | 13.2% |
| NC | Yancey | 13.1% |
| NC | Granville | 13.0% |
| NC | Lincoln | 13.0% |
| NC | Burke | 12.8% |
| NC | Davidson | 12.8% |
| NC | Harnett | 12.8% |
| NC | Stanly | 12.7% |
| NC | Rutherford | 12.5% |
| NC | Perquimans | 12.3% |
| NC | Mitchell | 12.2% |
| NC | Ashe | 12.1% |
| NC | Surry | 12.0% |
| NC | Alleghany | 11.7% |
| NC | Martin | 11.6% |
| NC | Warren | 11.6% |
| NC | Washington | 11.6% |
| NC | Robeson | 11.4% |
| NC | Bladen | 11.3% |
| NC | Wilkes | 11.3% |
| NC | Graham | 11.2% |
| NC | Halifax | 11.1% |
| NC | Hertford | 11.1% |
| NC | Randolph | 11.1% |
| NC | Sampson | 11.1% |
| NC | Cherokee | 11.0% |
| NC | Hoke | 10.9% |
| NC | Northampton | 10.8% |
| NC | Rockingham | 10.8% |
| NC | Vance | 10.7% |
| NC | Hyde | 10.6% |
| NC | Tyrrell | 10.6% |
| NC | Duplin | 10.5% |
| NC | Gates | 10.5% |
| NC | Caldwell | 10.4% |
| NC | Person | 10.3% |
| NC | Yadkin | 10.3% |
| NC | Columbus | 10.1% |
| NC | Richmond | 10.1% |
| NC | Montgomery | 10.0% |
| NC | Jones | 9.5% |
| NC | Alexander | 9.3% |
| NC | Stokes | 9.3% |
| NC | Anson | 9.2% |
| NC | McDowell | 9.0% |
| NC | Bertie | 8.8% |
| NC | Edgecombe | 8.5% |
| NC | Caswell | 8.3% |
| NC | Greene | 8.2% |
| (Max-Min)-based legend binning |