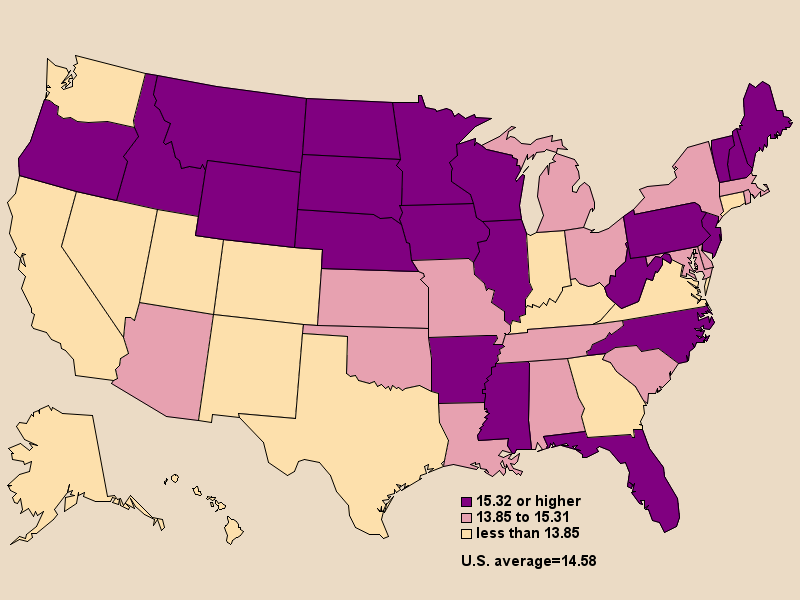
Breast Cancer
Estimated deaths due to breast cancer per 100,000 population, by state, 1994
Women's most common cancer causes the most deaths in northeastern and Great Lakes states


Source: American Demographics' calculations based on American Cancer Society death estimates
and Census Bureau population estimates


Prostate Cancer
Estimated deaths due to prostate cancer per 100,000 population, by state, 1994
The most common cancer to afflict men hits hardest in North Carolina and in many midwestern states


Source: American Demographics' calculations based on American Cancer Society death estimates
and Census Bureau population estimates


State Breast Cancer rate per
100,000
Prostate Cancer rate
per 100,000
Alaska less than 16.79 less than 13.85
Alabama less than 16.79 13.85 to 15.31
Arkansas 18.56 or higher 15.32 or higher
Arizona less than 16.79 13.85 to 15.31
California less than 16.79 less than 13.85
Colorado less than 16.79 less than 13.85
Connecticut 16.79 to 18.55 less than 13.85
Delaware 18.56 or higher 13.85 to 15.31
Florida 18.56 or higher 15.32 or higher
Georgia less than 16.79 less than 13.85
Hawaii less than 16.79 less than 13.85
Iowa 18.56 or higher 15.32 or higher
Idaho less than 16.79 15.32 or higher
Illinois 18.56 or higher 15.32 or higher
Indiana 18.56 or higher less than 13.85
Kansas 18.56 or higher 13.85 to 15.31
Kentucky 16.79 to 18.55 less than 13.85
Louisiana 16.79 to 18.55 13.85 to 15.31
Massachusetts 18.56 or higher 13.85 to 15.31
Maryland 16.79 to 18.55 13.85 to 15.31
Maine 16.79 to 18.55 15.32 or higher
Michigan 16.79 to 18.55 13.85 to 15.31
Minnesota 16.79 to 18.55 15.32 or higher
Missouri 18.56 or higher 13.85 to 15.31
Mississippi less than 16.79 15.32 or higher
Montana 16.79 to 18.55 15.32 or higher
North Carolina 16.79 to 18.55 15.32 or higher
North Dakota 18.56 or higher 15.32 or higher
Nebraska 18.56 or higher 15.32 or higher
New Hampshire 18.56 or higher 15.32 or higher
New Jersey 18.56 or higher 15.32 or higher
New Mexico less than 16.79 less than 13.85
Nevada less than 16.79 less than 13.85
New York 18.56 or higher 13.85 to 15.31
Ohio 18.56 or higher 13.85 to 15.31
Oklahoma 16.79 to 18.55 13.85 to 15.31
Oregon less than 16.79 15.32 or higher
Pennsylvania 18.56 or higher 15.32 or higher
Rhode Island 18.56 or higher 13.85 to 15.31
South Carolina less than 16.79 13.85 to 15.31
South Dakota 16.79 to 18.55 15.32 or higher
Tennessee 16.79 to 18.55 13.85 to 15.31
Texas less than 16.79 less than 13.85
Utah less than 16.79 less than 13.85
Virginia 16.79 to 18.55 less than 13.85
Vermont 18.56 or higher 15.32 or higher
Washington less than 16.79 less than 13.85
Wisconsin 18.56 or higher 15.32 or higher
West Virginia 18.56 or higher 15.32 or higher
Wyoming less than 16.79 15.32 or higher