Robert Allison's Graphical Analytics #8
Click on thumbnail to see full-size chart.
Click on label to see descriptions and SAS code.
Slicing Visualization
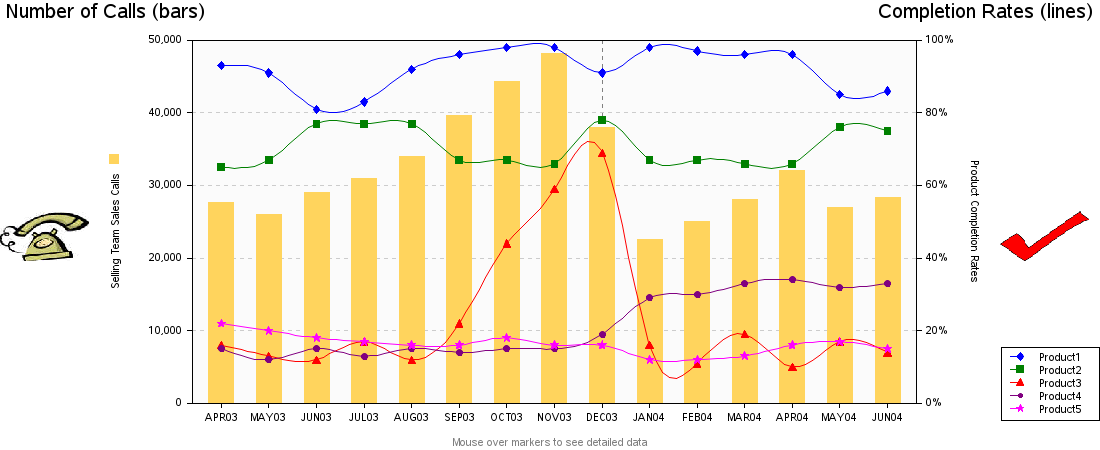
Call Center Analysis
Dow Jones Trendline
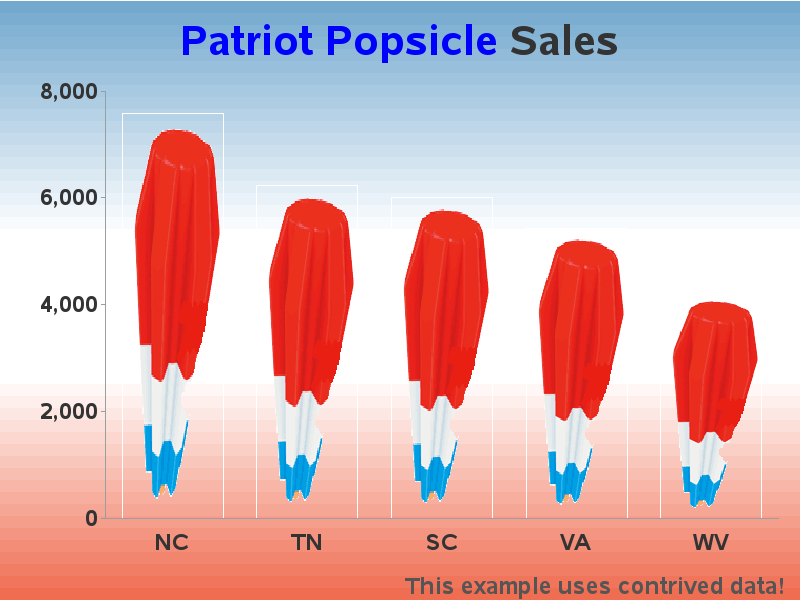
Popsicle Sales
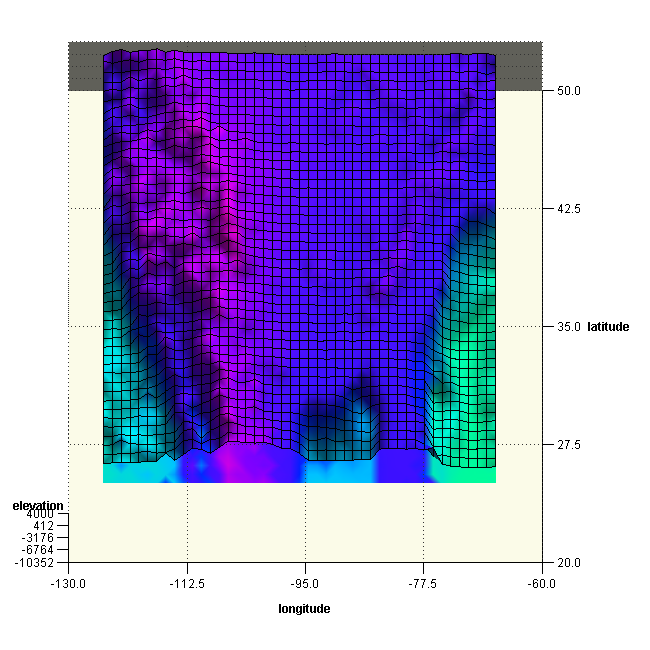
Activex 3d Contour
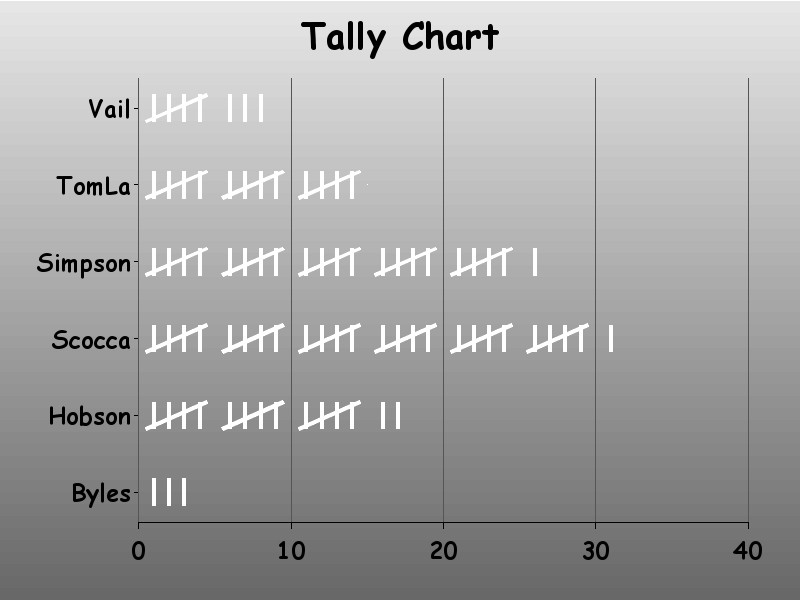
Hatch Mark Tally Chart
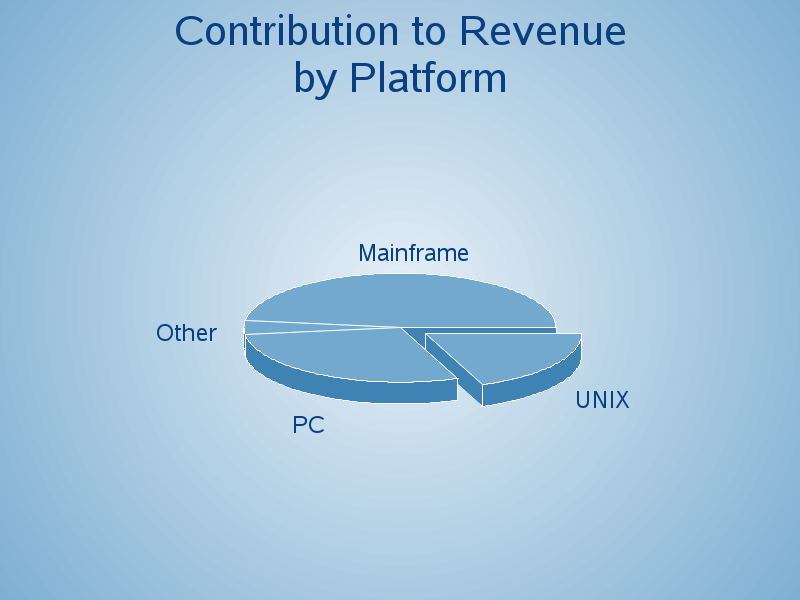
Lighting on 3D Pie
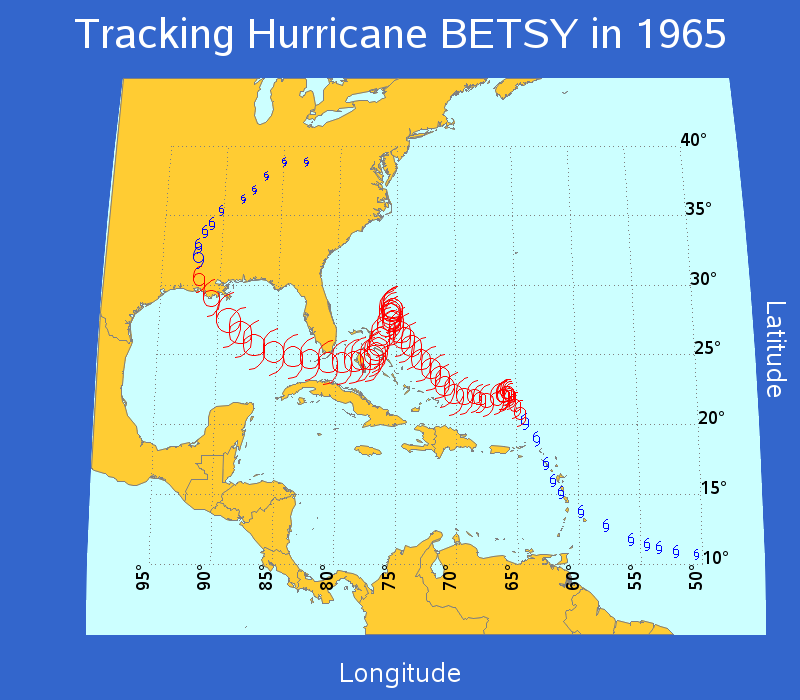
Atlantic Hurricanes
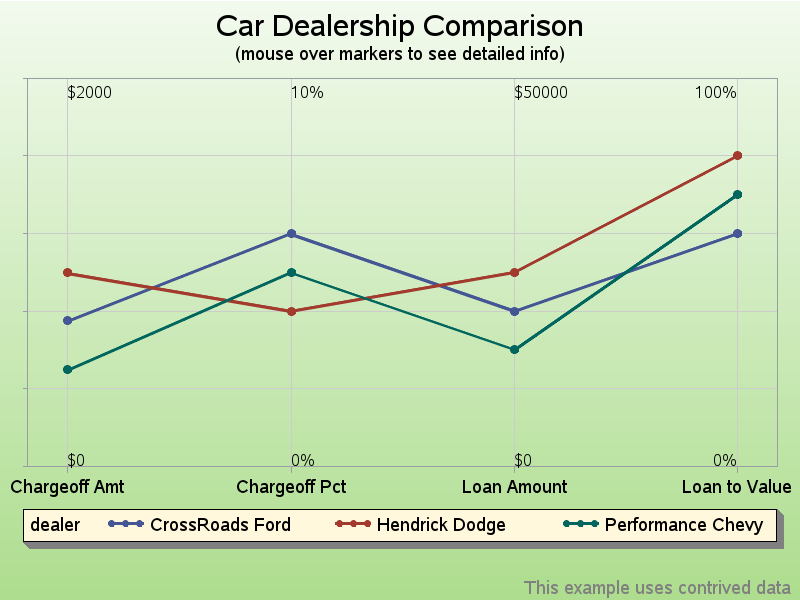
Multiple Axes Comparisons
Radar Chart Compare
Star Chart Comparison
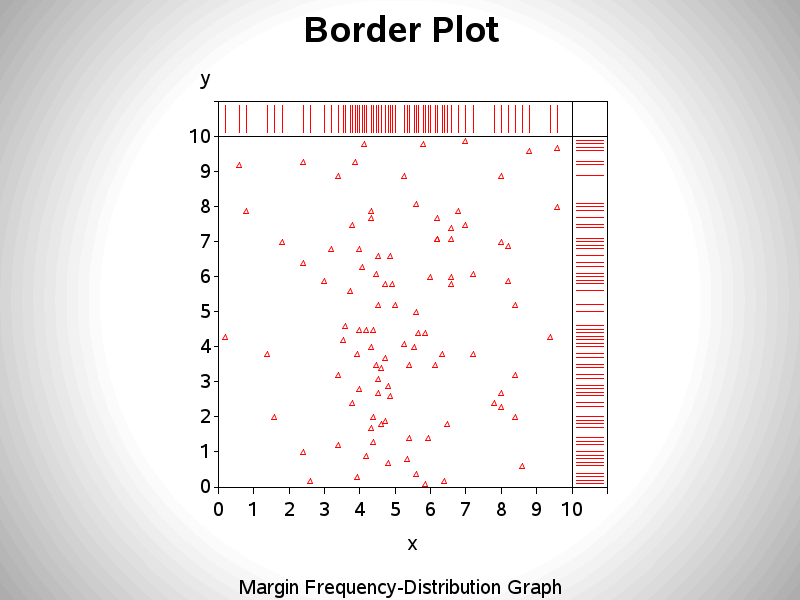
Frequency Distribution
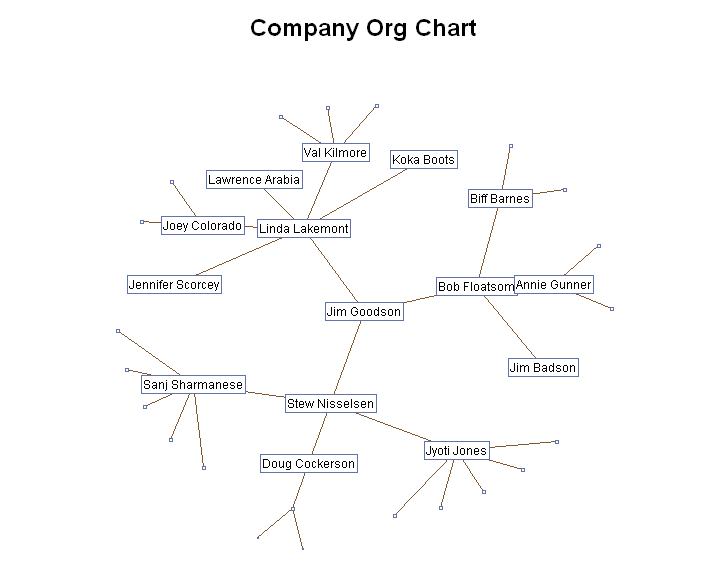
Interactive Java Tree Chart
Proc GAreaBar Chart
Pie Chart as Time Clock
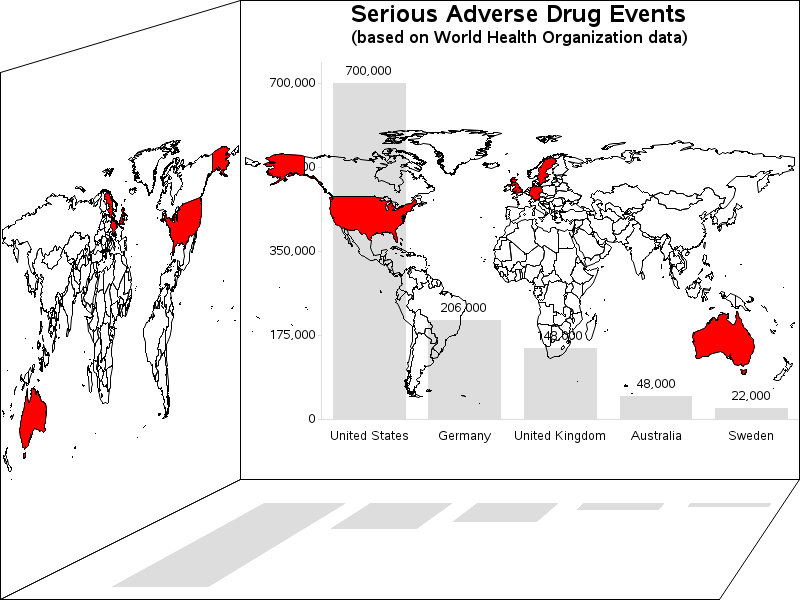
Greplay 'Cube' Trick
These samples courtesy of Robert Allison
Please see the following README

