DonorsChoose.org SAS/Graph Samples
Click on thumbnail to see full-size chart.
Click on label to see descriptions and SAS code.
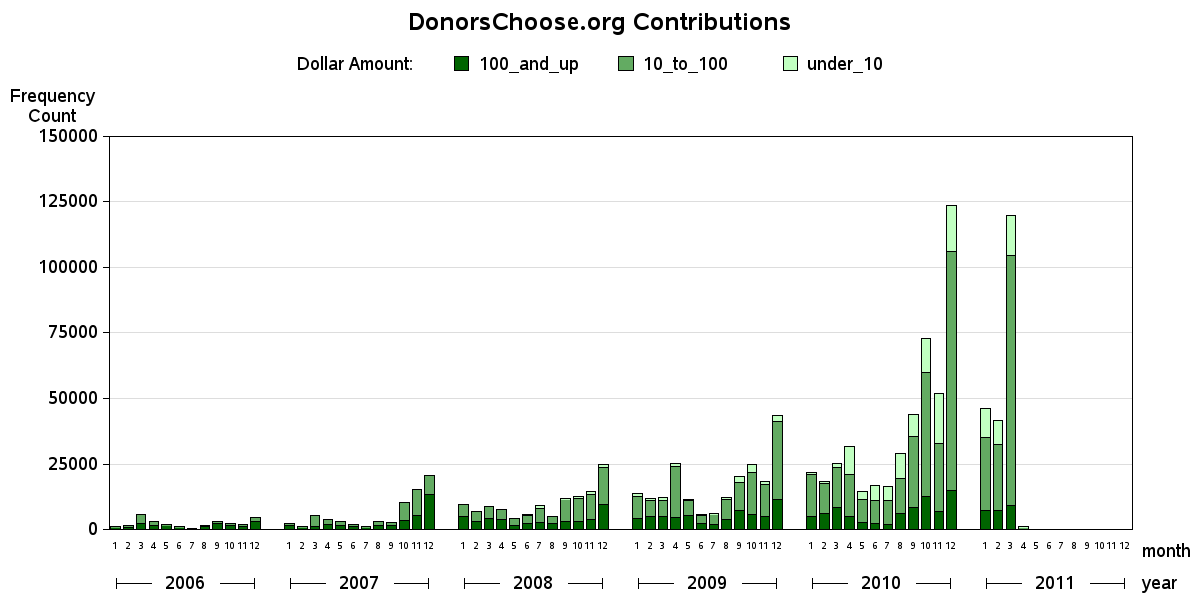
Contributions by Year
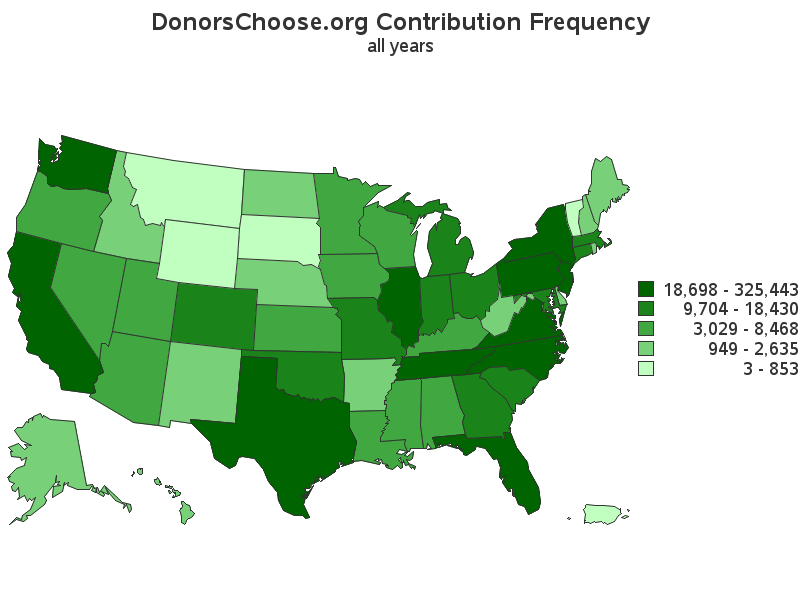
Contributions by State
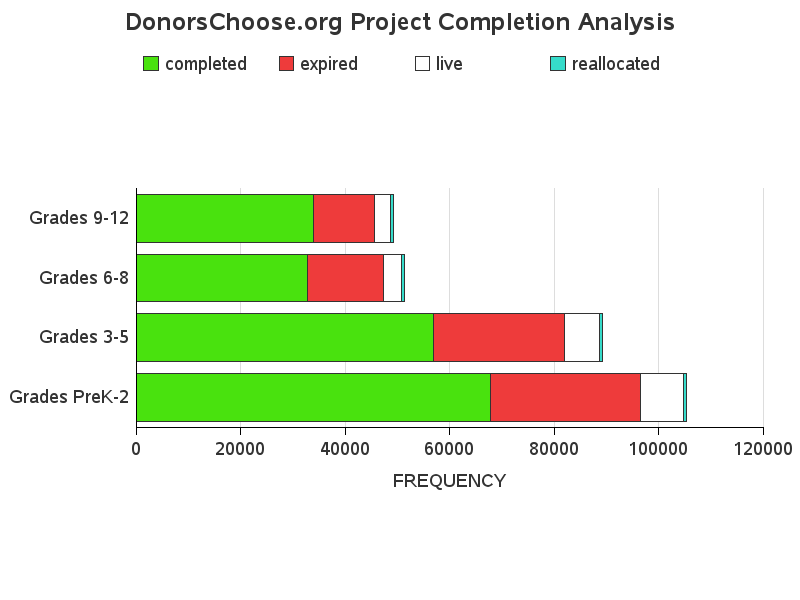
Project Frequency Count
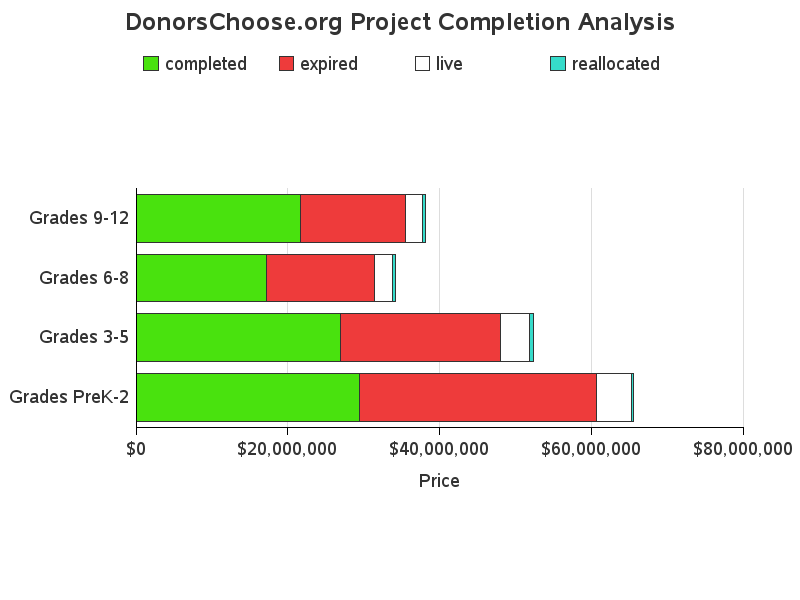
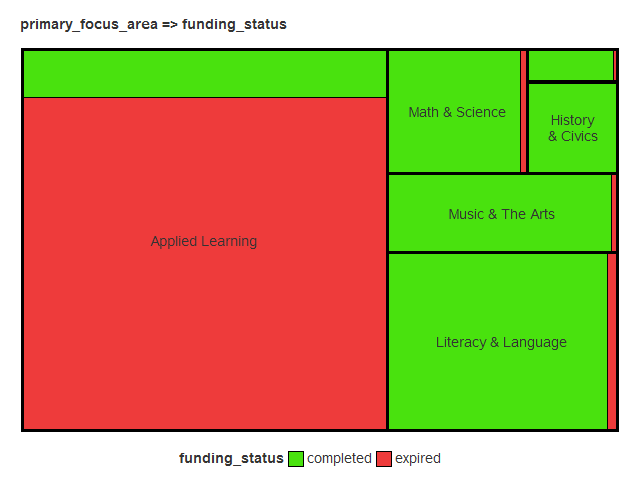
Project $ Values
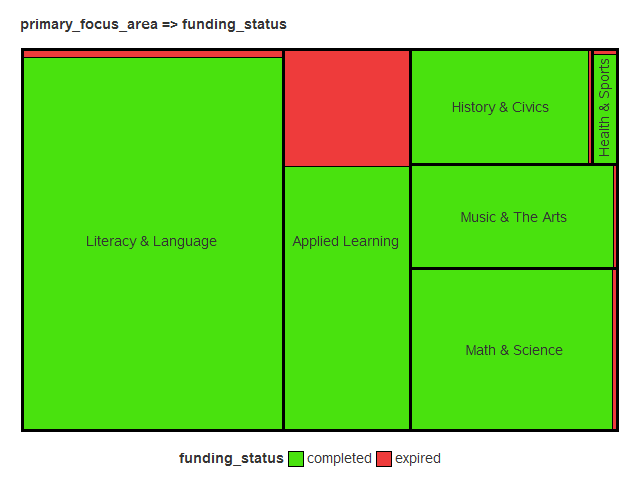
Project Frequency Count
$-Value of Projects
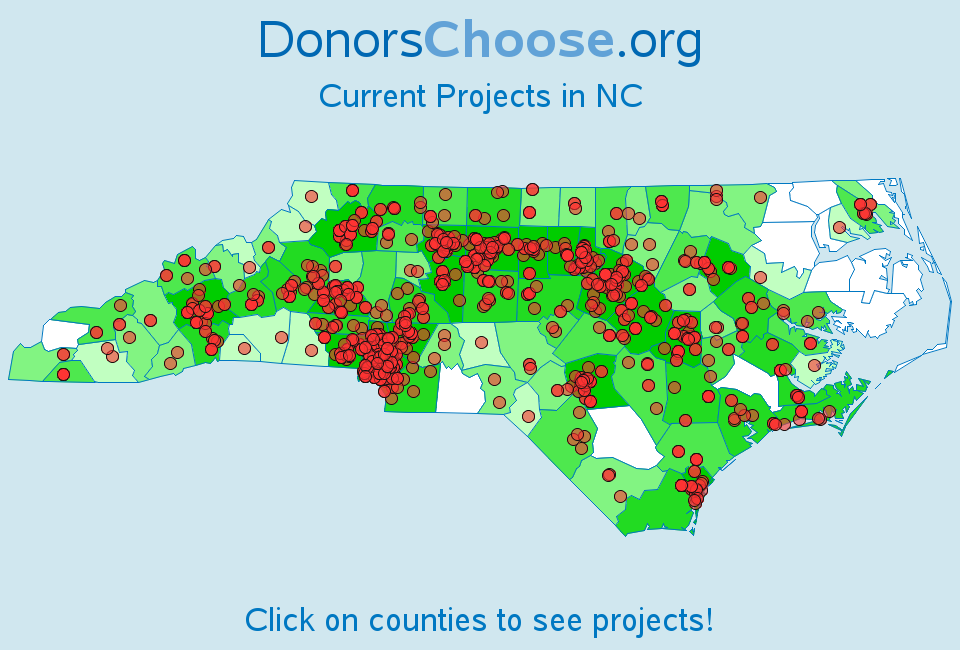
MapBased iPhone GUI
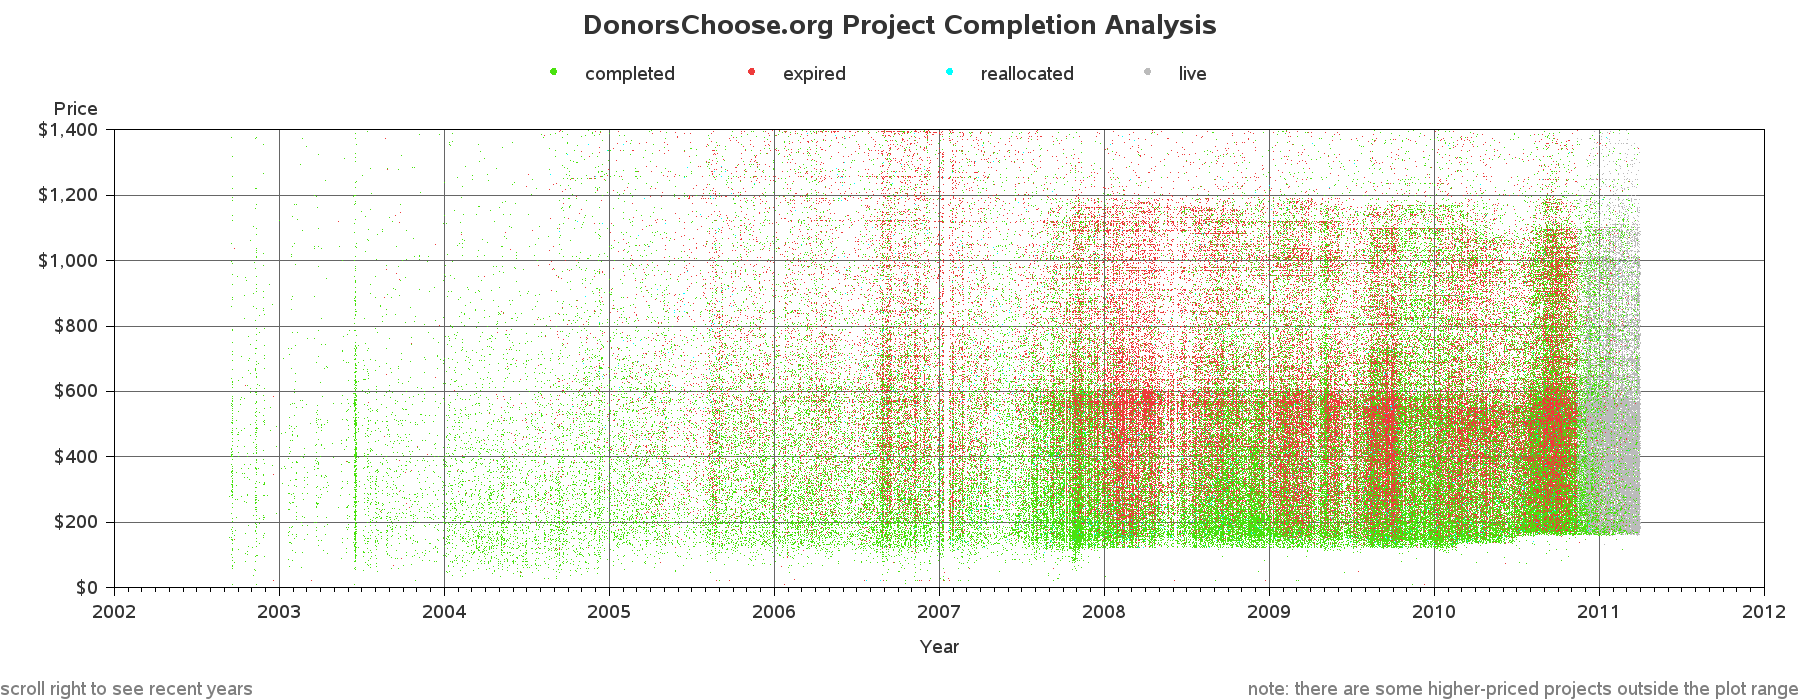
Mega Scatter Plot
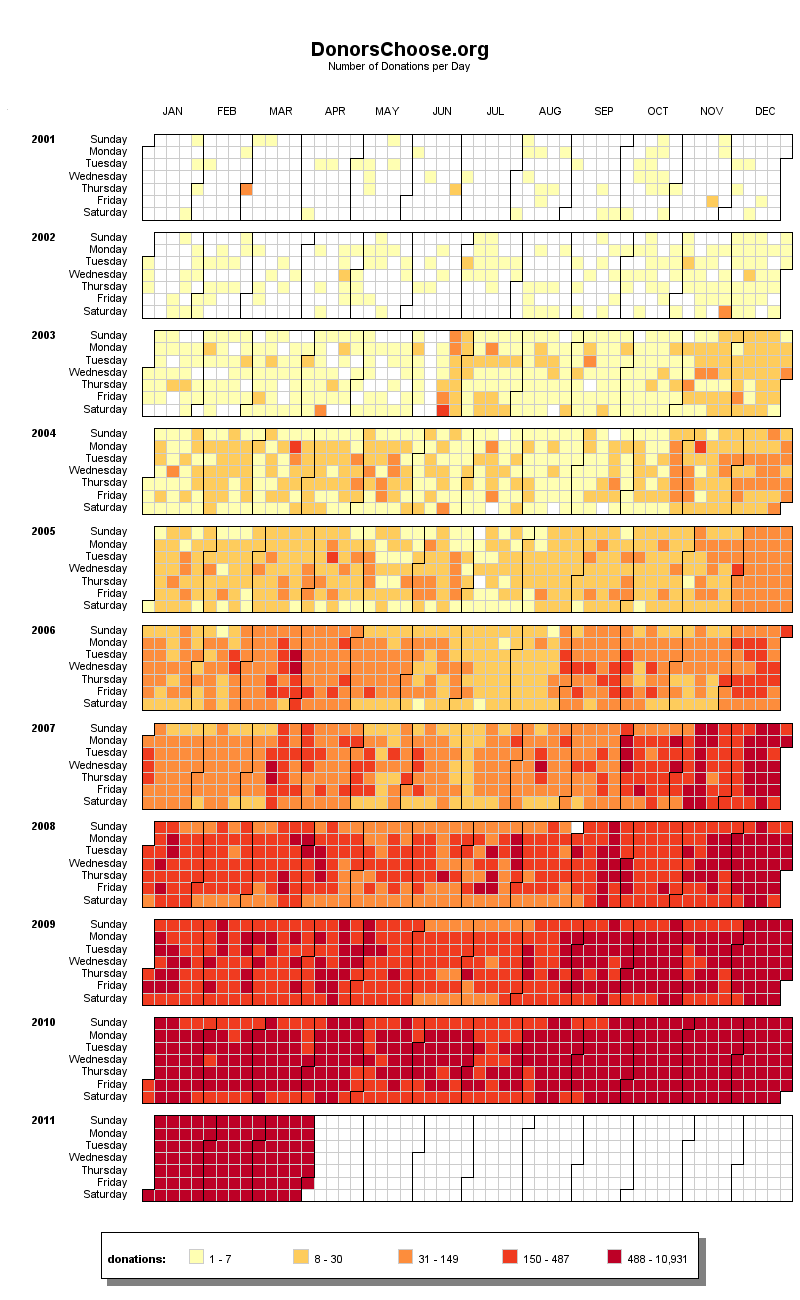

# of Donations Per Day
# of Donors Per Day
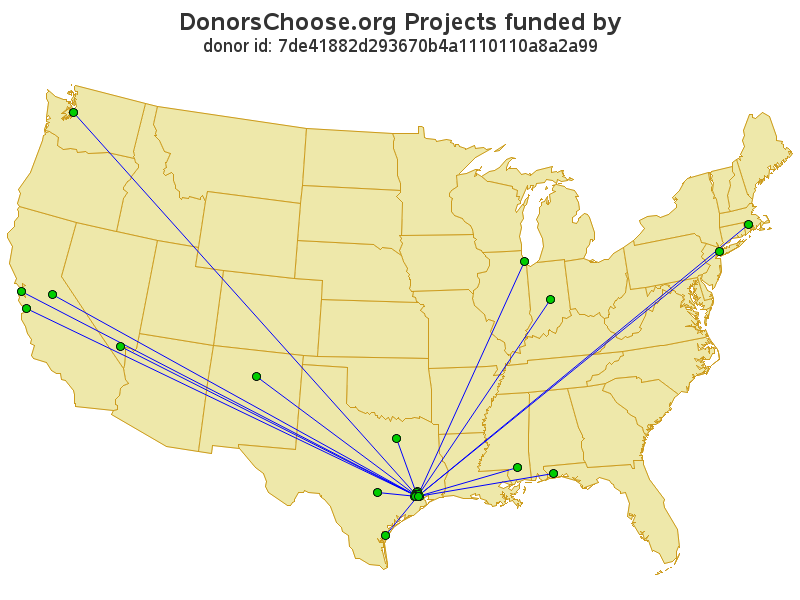
Map of Donor's Impact
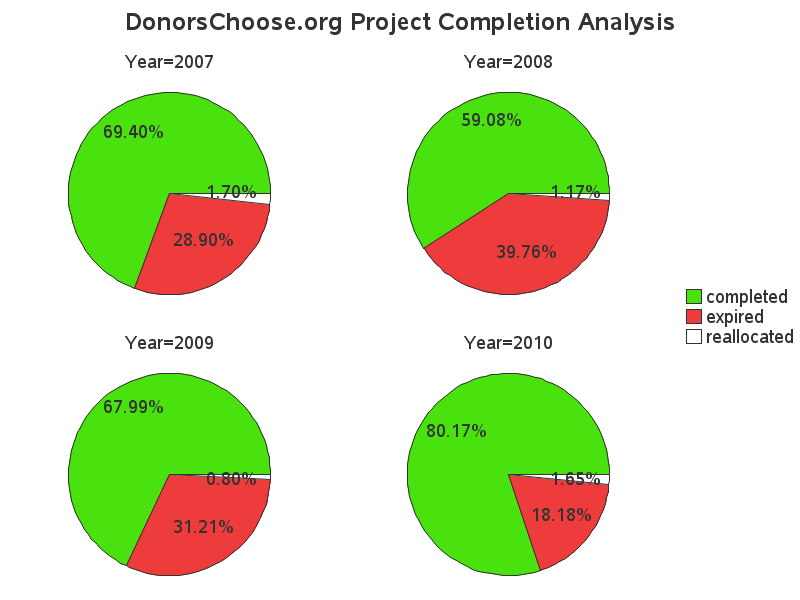
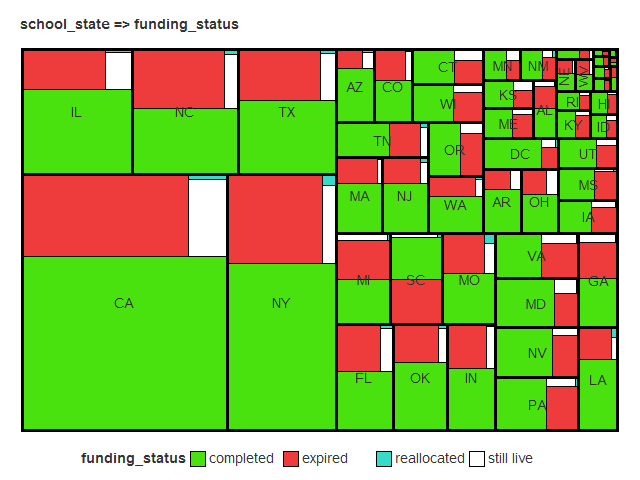
Project Completion
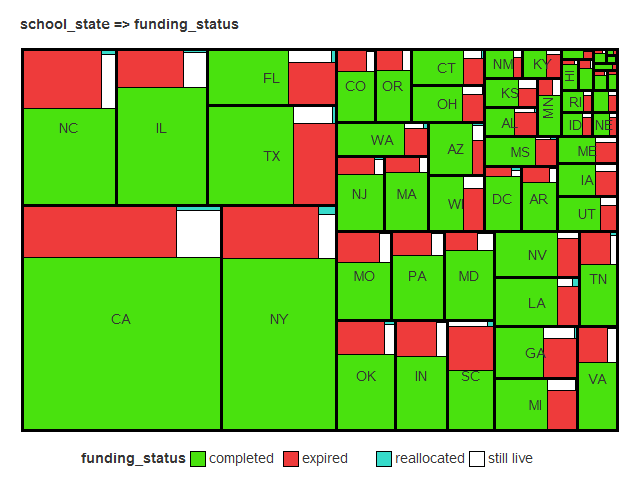

Num Projects per State
Dollar Value per State
SAS for Proofreading
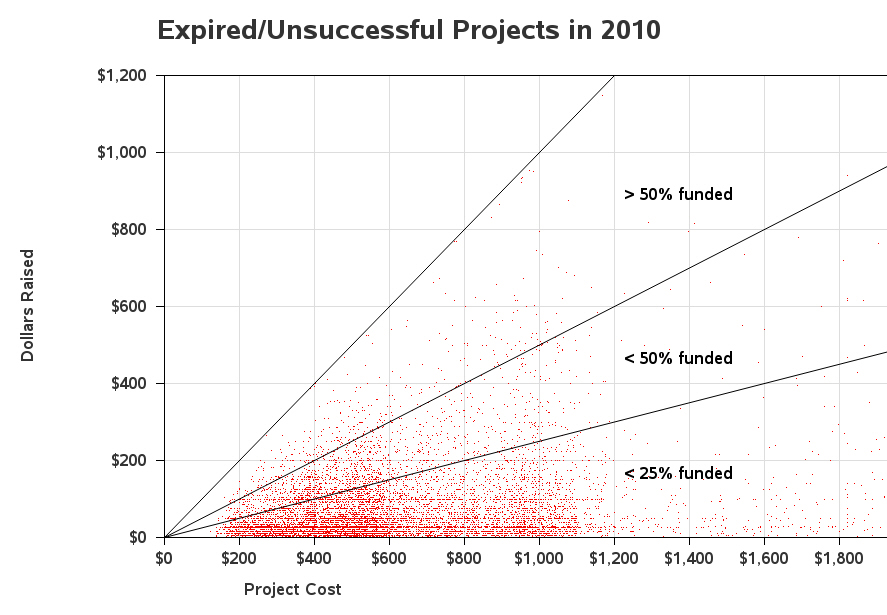
Unsuccessful Projects
These samples courtesy of Robert Allison
Please see the following README