Robert Allison's SAS/Graph Samples #35
Click on thumbnail to see full-size chart.
Click on label to see descriptions and SAS code.
Plotting Data with a 'Time' Element...
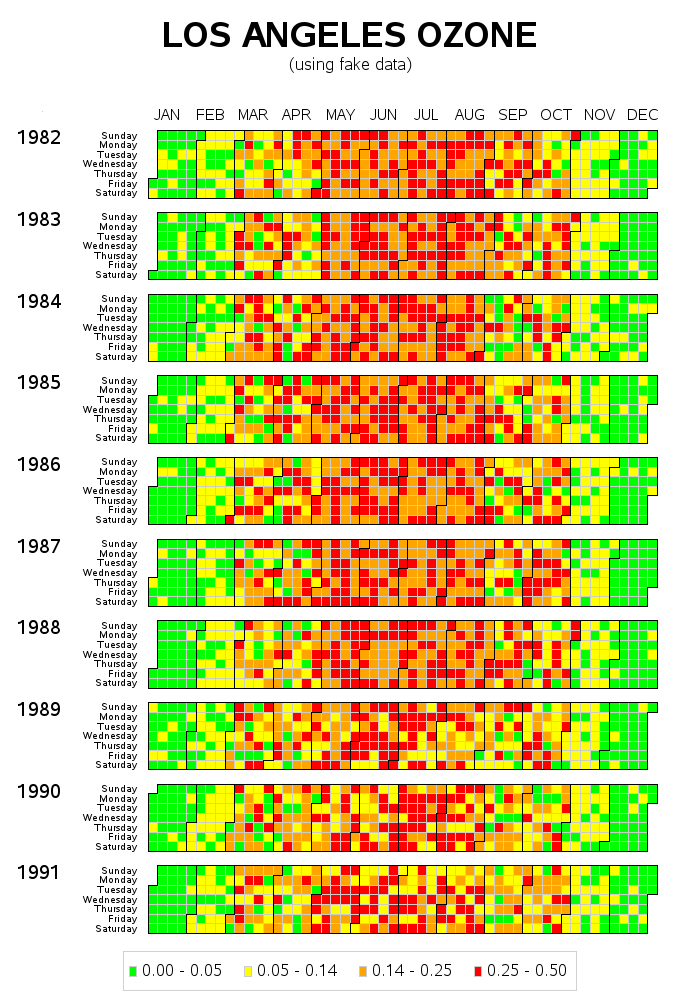
Smog Calendar Chart
CPU Usage Plots
Allergy Calendar
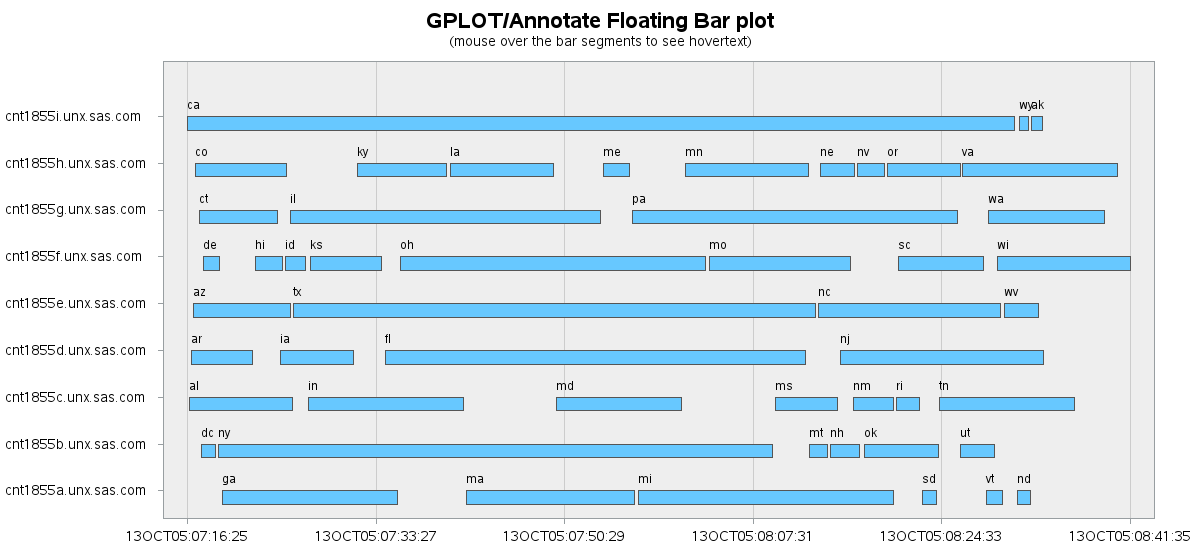
Gantt / Bar Chart
High Altitude Balloon
Crime Animation
Population Animation
Stock Market
Temperature boxplot
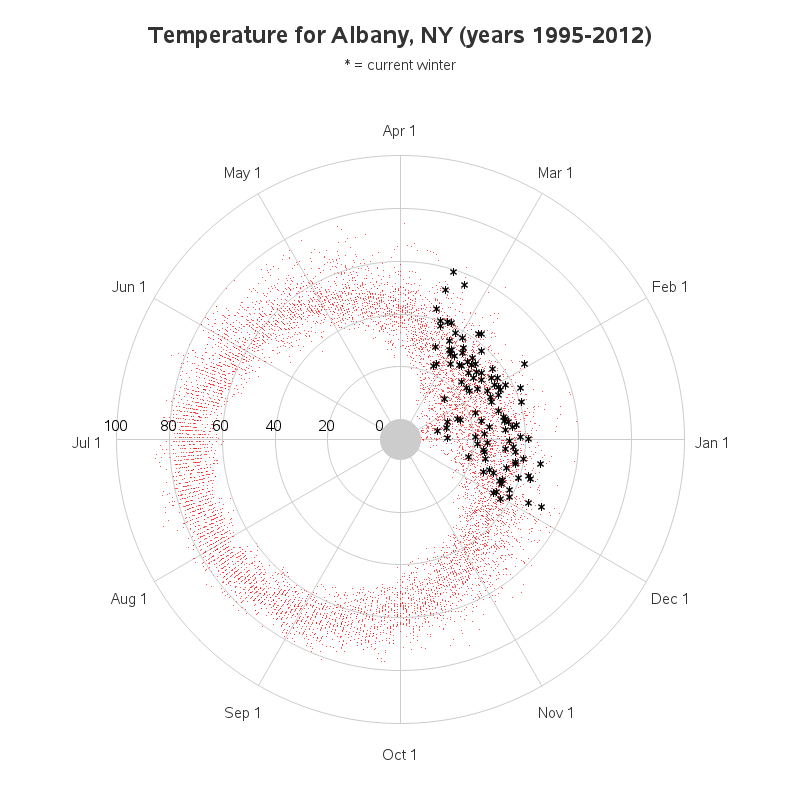
Circular Calendar
Earthquake Months
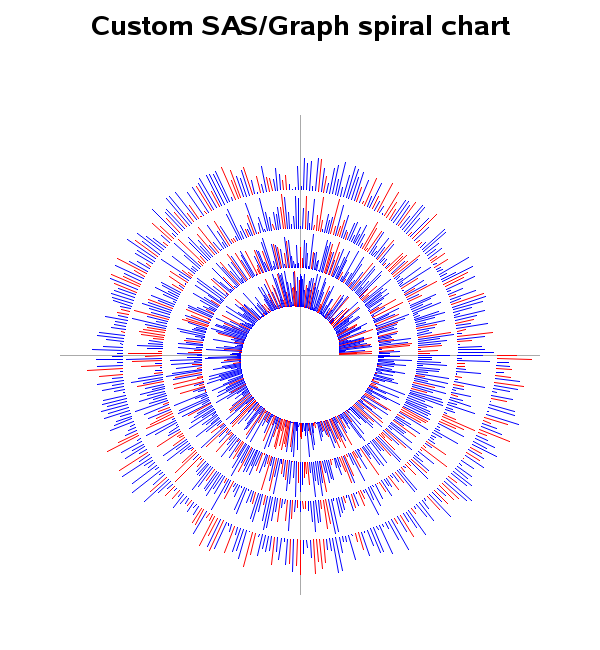
Spiral Chart
Lake Jordan Water Level (1983-present)
Automotive Warranty Work Chart
Napoleon's Russian Campaign, 1812
Chess Masters Data: Rating -vs- Age
Number of Poor, and Poverty Rate
Logarithmic Axes for long Time-Series
Time-Series Graph from an Image
These samples courtesy of Robert Allison
Please see the following README


