Robert Allison's SAS/Graph Examples #12
Click on thumbnail to see full-size chart.
Click on label to see description and SAS code.
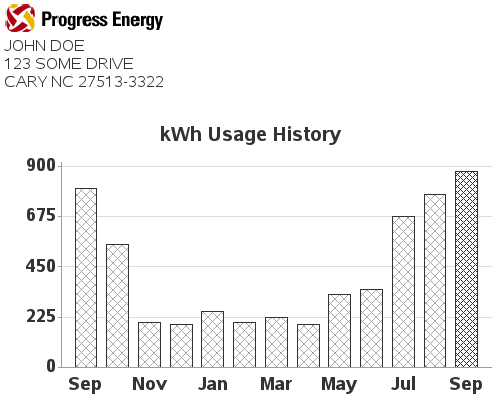
Online Power Bill Plot
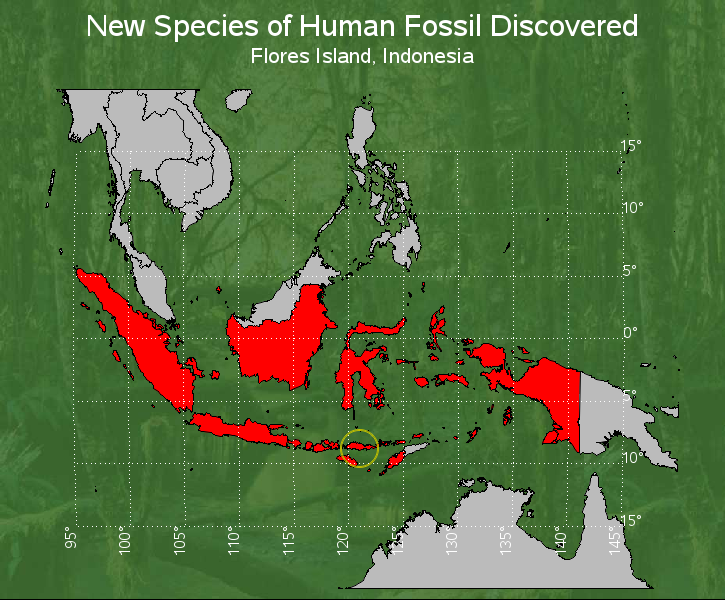
New Human Species
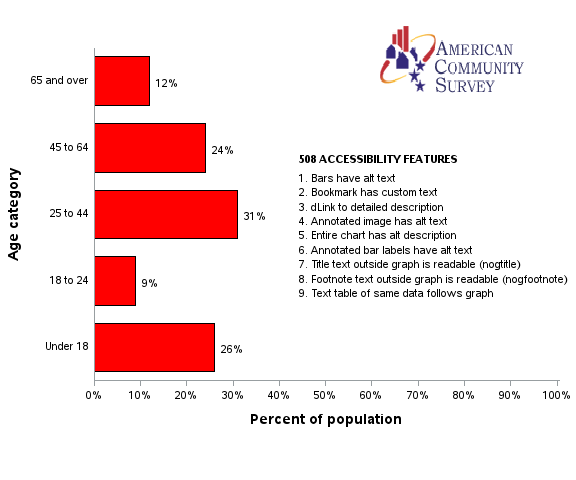
508 Accessibile Graph
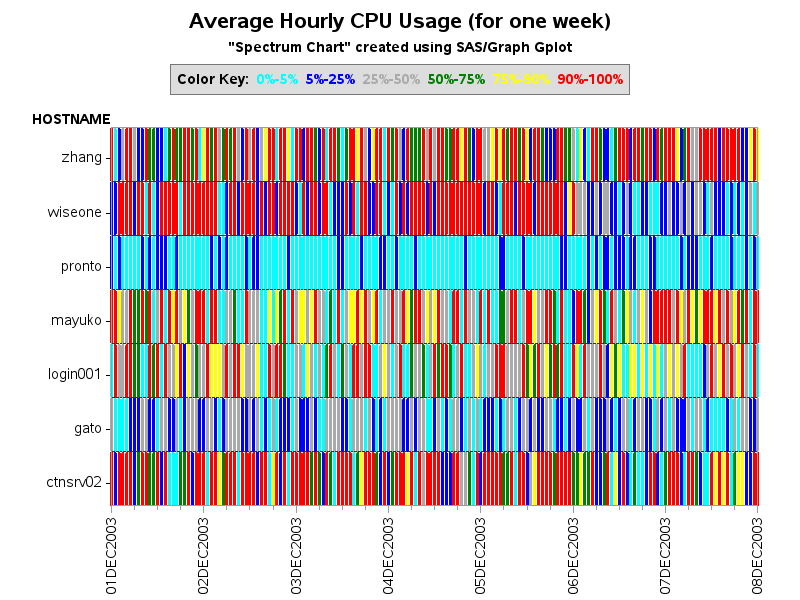
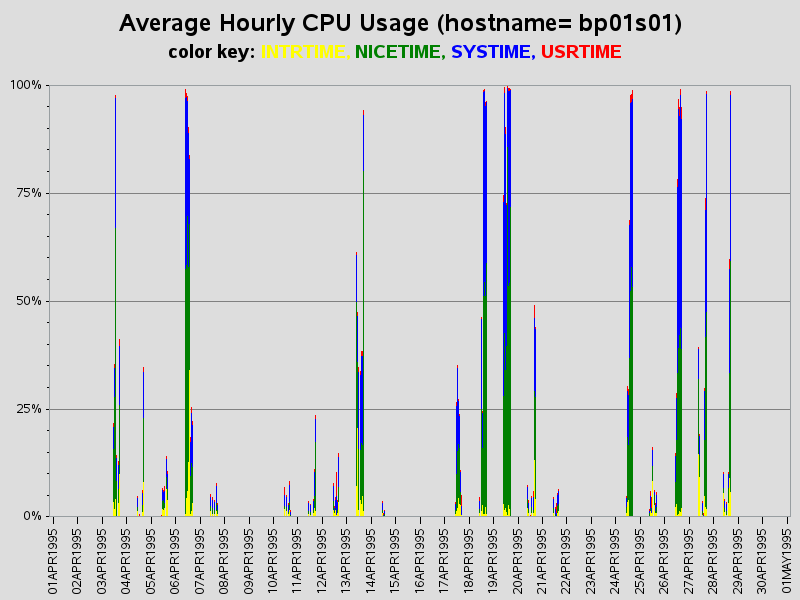
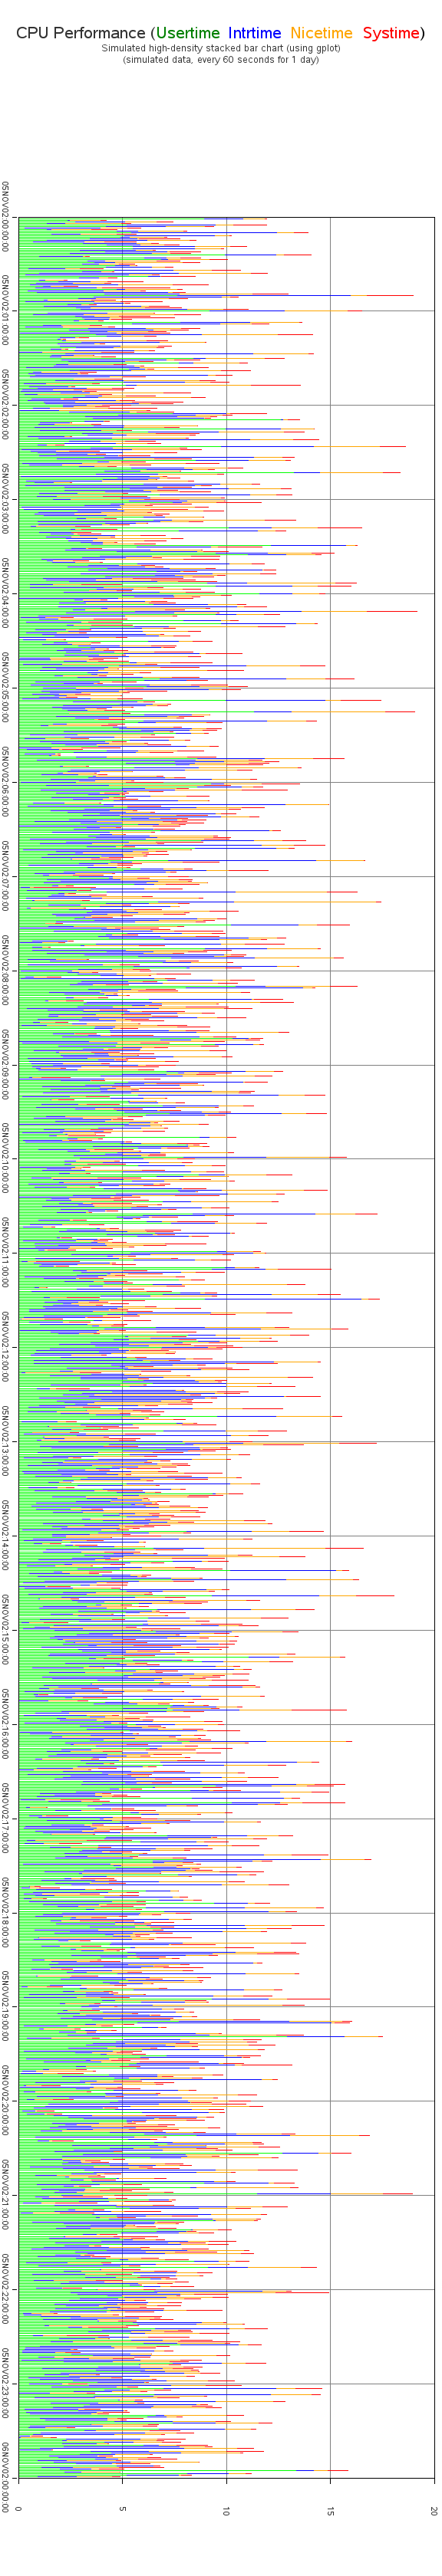
Hourly CPU Plot
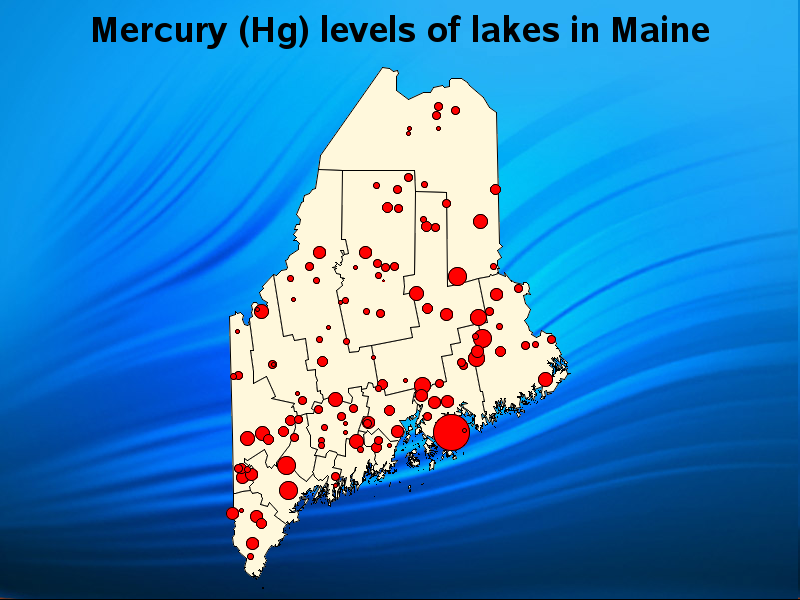
Lake Mercury Levels
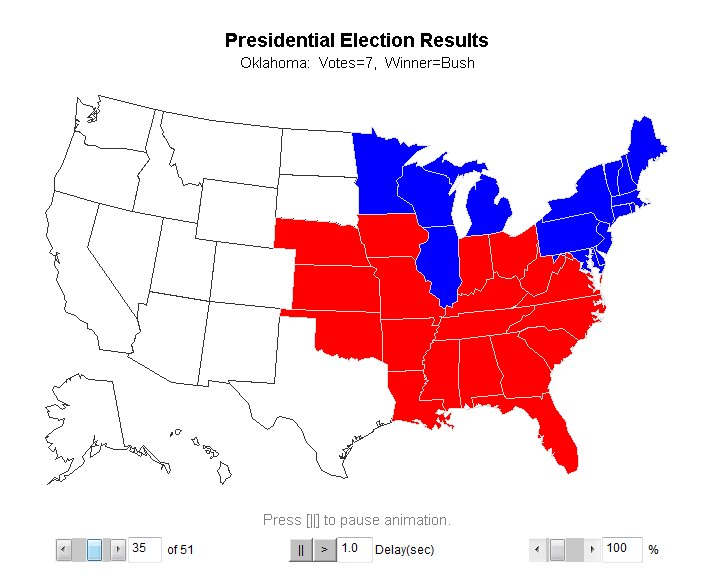
javameta Animation
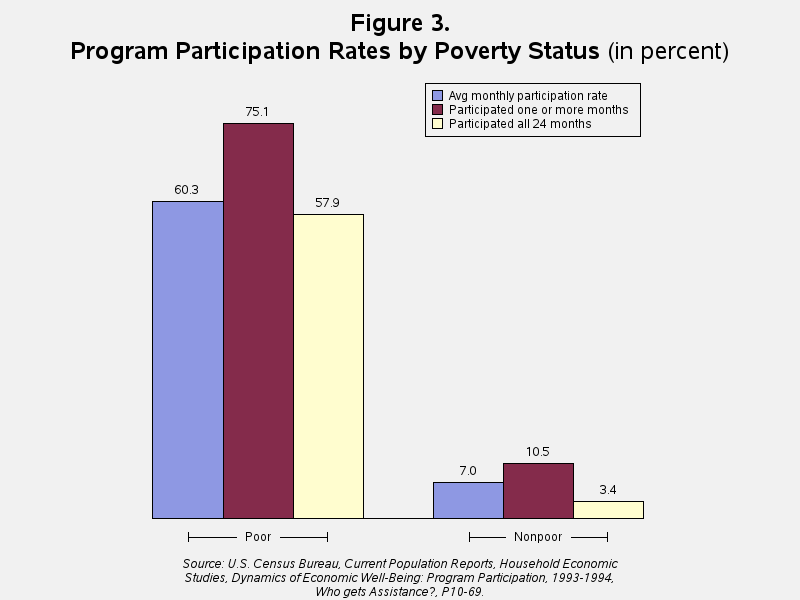
US Poverty Rate
Hourly CPU, 28 days
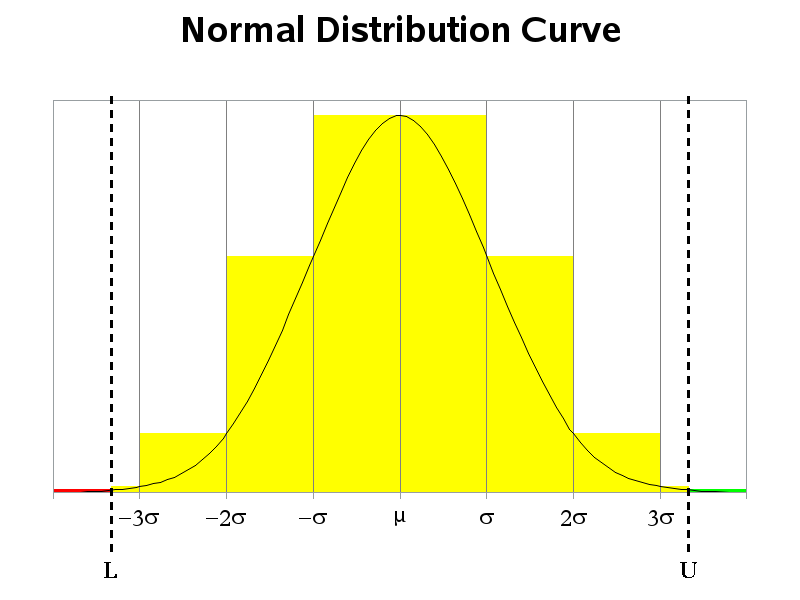
Normal Distribution Curve
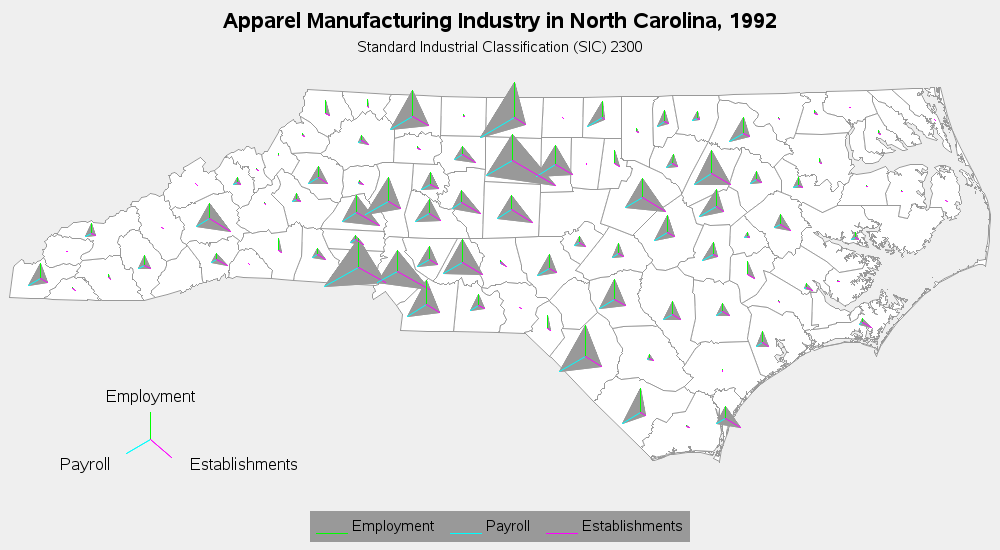
Map With Radar Charts
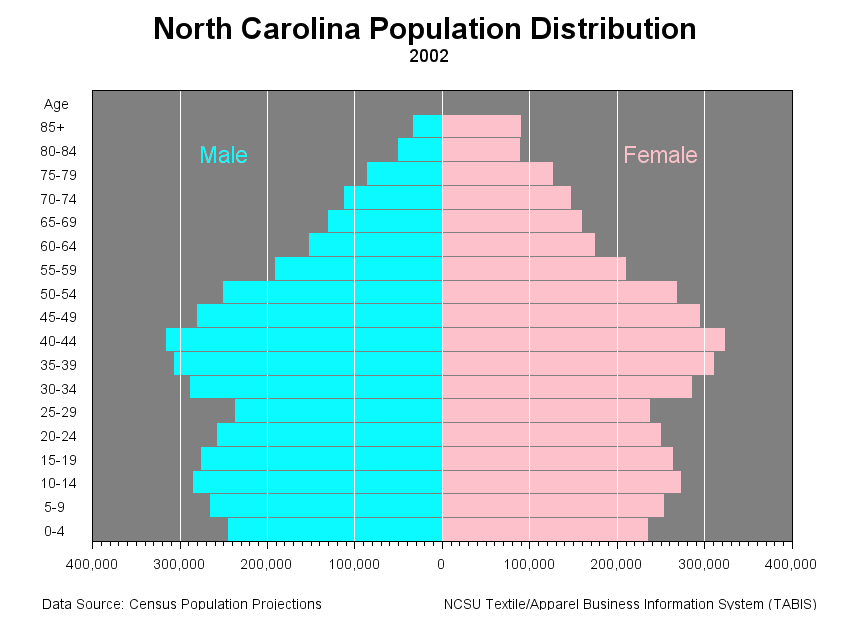
Population Animation
CPU by minute, 1 day
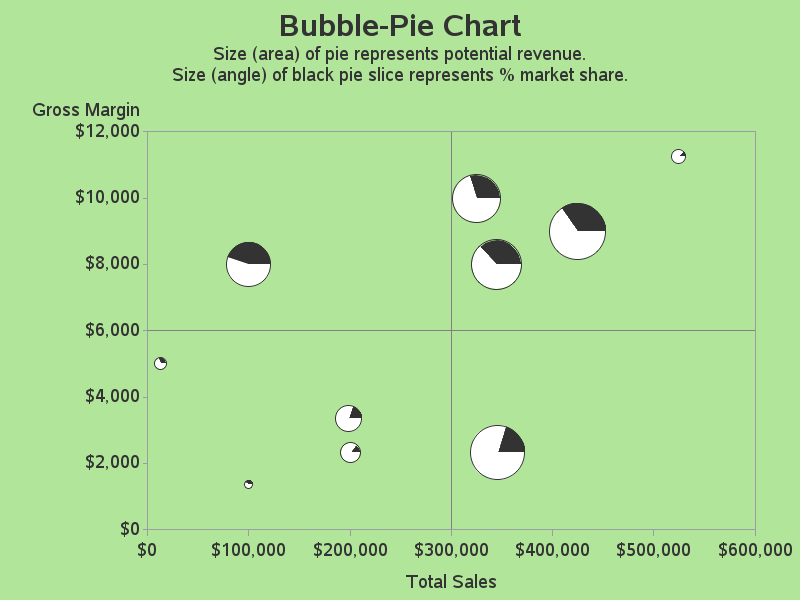
Custom Bubble-Pie Chart
Morehead City Weather
javameta Animation
GPRINT Gif Animation

![]()
These samples courtesy of Robert Allison
Please see the following README