Robert Allison's Manufacturing-Related SAS Graphs
Click on thumbnail to see full-size chart. Click on label to see descriptions and SAS code.
Choosing a Market or Business to go into ...
Smartphones in the US
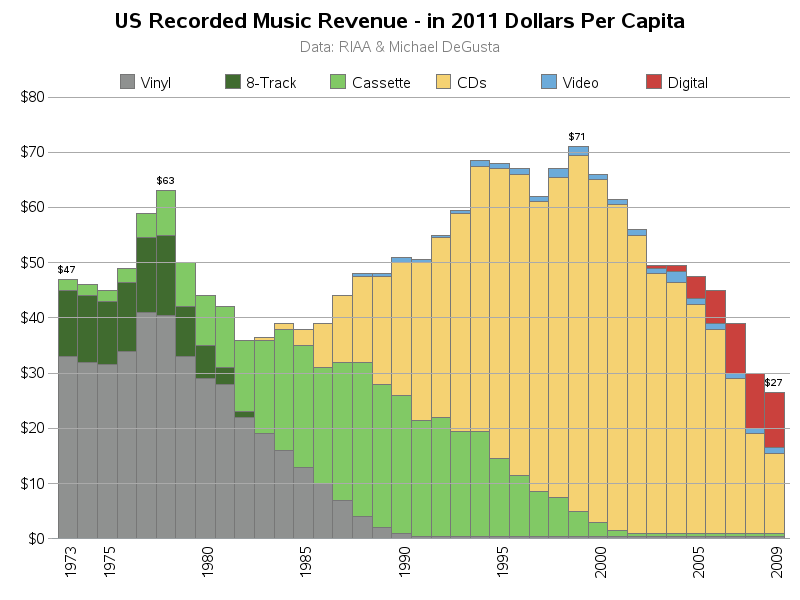
RIAA Music Revenue
Population Animation
Consumer Price Index
European Expenditures
World Demographics
Texting Msgs vs Voice
Hybrid Sales in the US
Automobile Sales Trend
Automakers Volume
Where the Boys Aren't
Research Competition
Plant Location Considerations ...
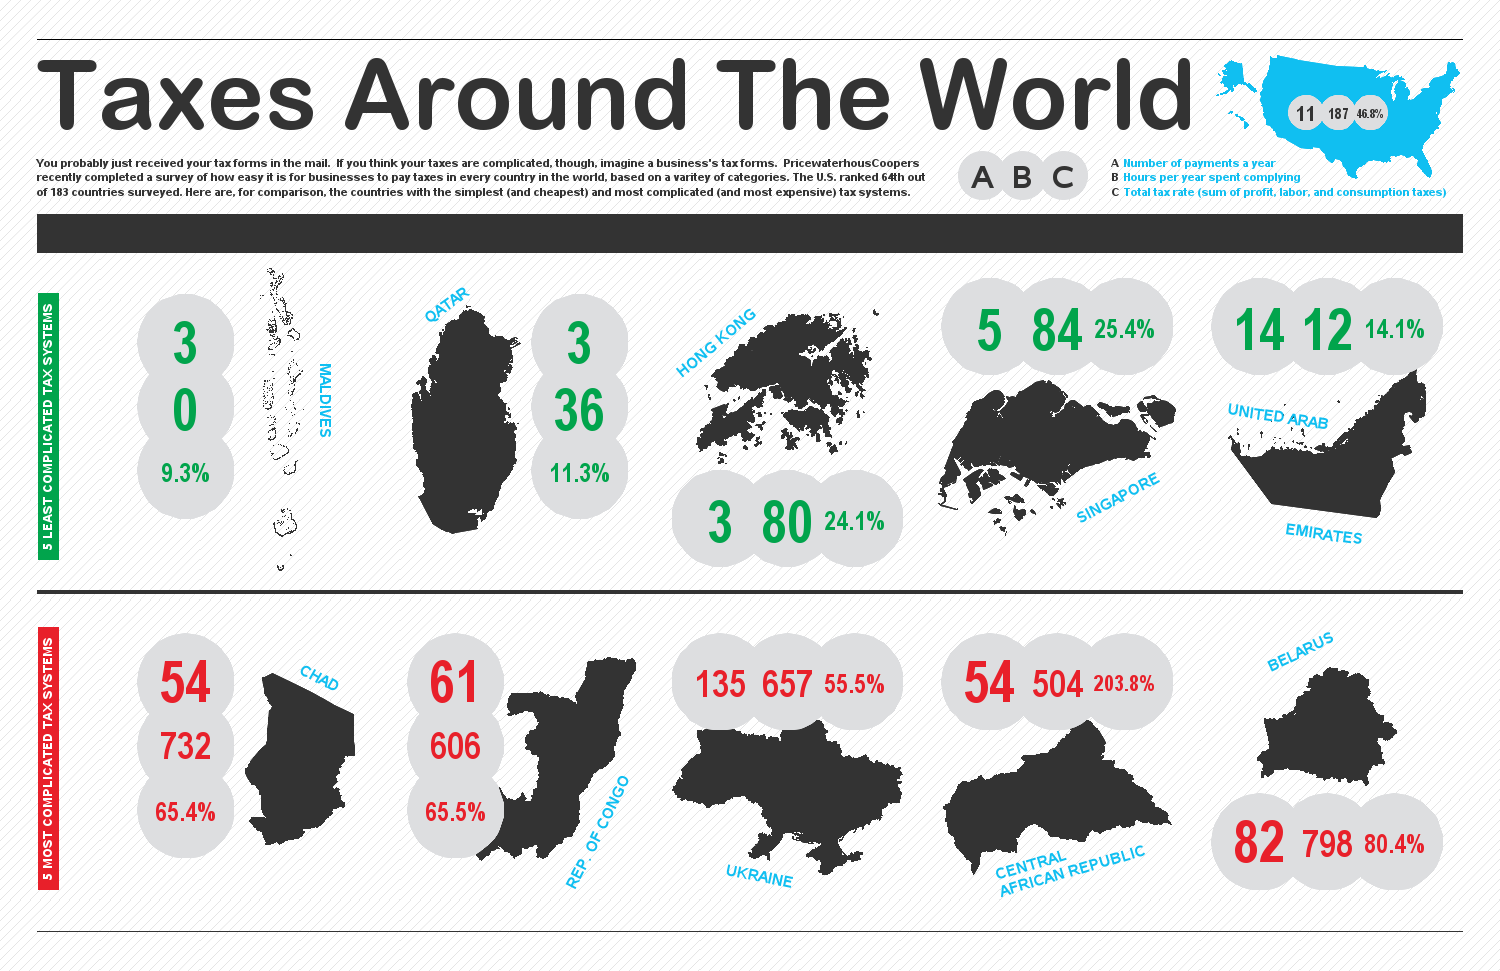
World Tax Comparison
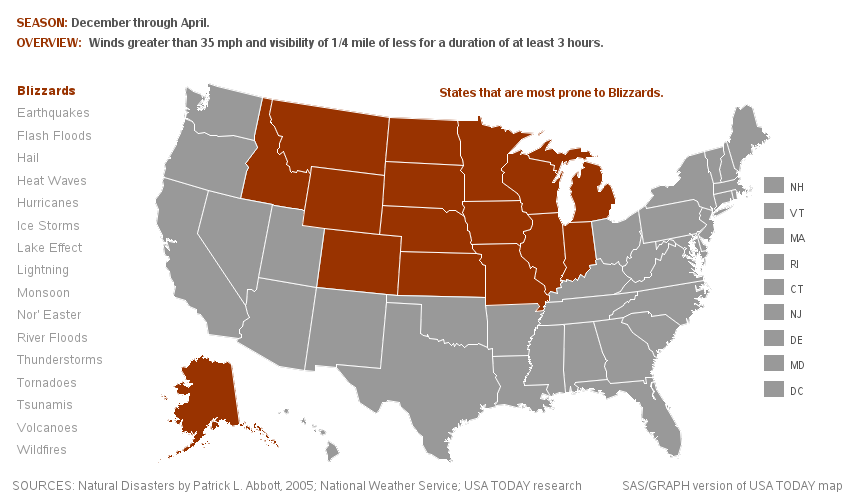
Natural Disasters Map
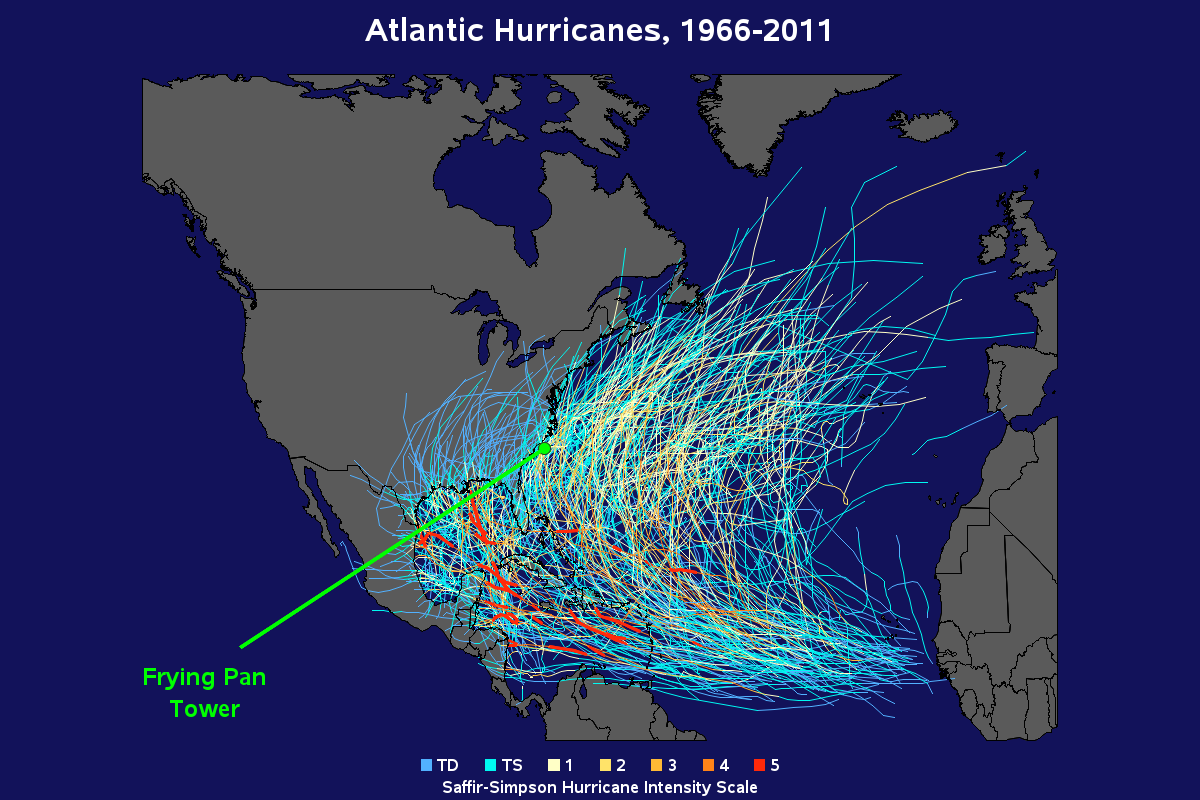
East Coast Hurricanes
Electricity Prices
Walmart Growth Anim.
Fedex Delivery Estimate
Transportation Route
Unemployment Anim.
Nanotech Valley Search
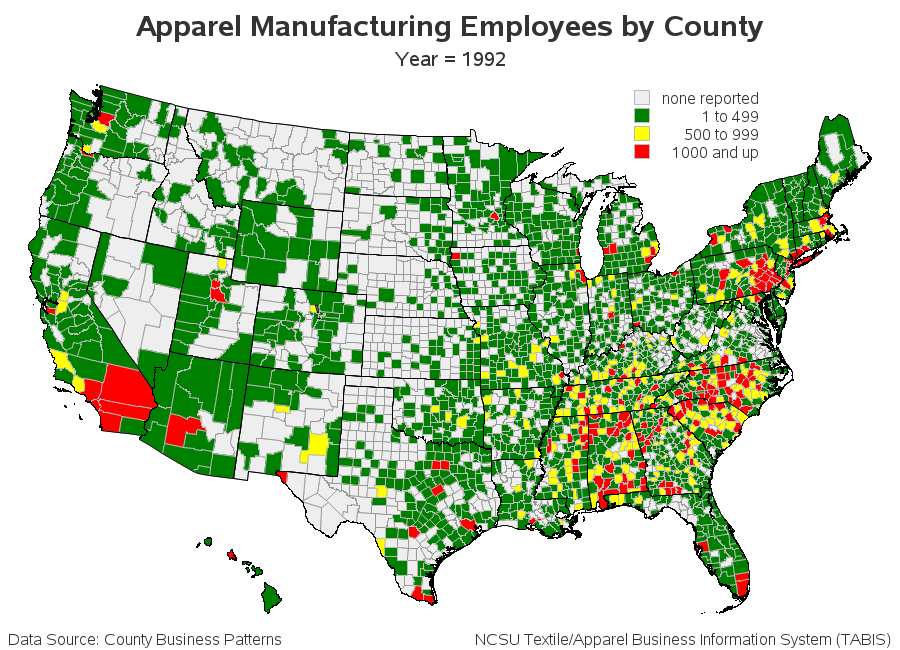
Apparel Manufacture
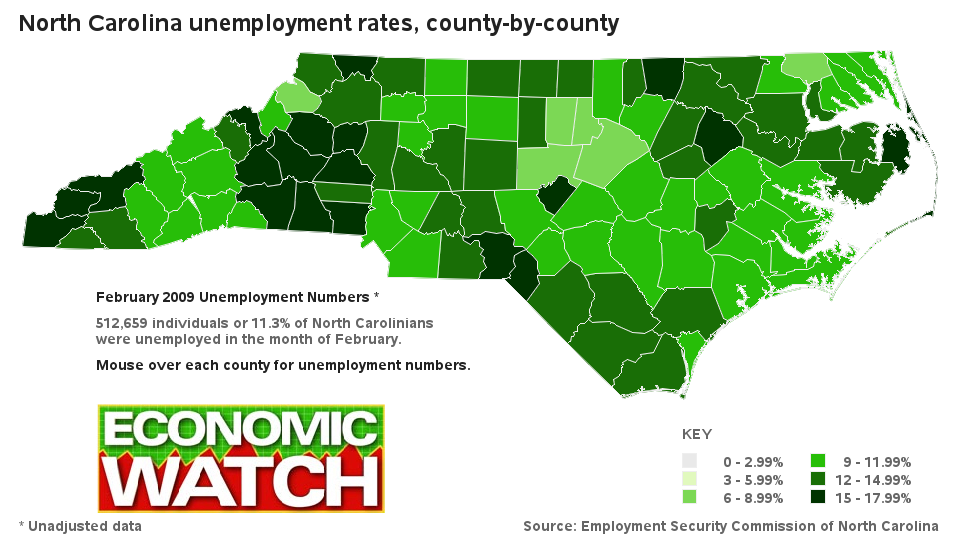
Unemployment in NC
Apparel Manufacturing
Employee Workforce and Wages ...
State Unemployment
College Major Statistics
Alternative Unemp.
County Unemployment
College Grad Salaries
College Major Statistics
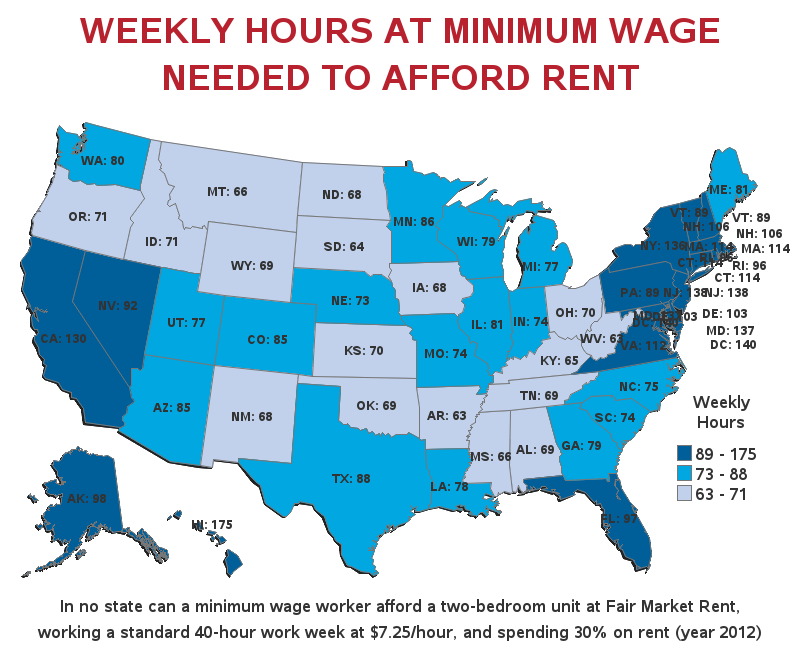
Wages & Rent
Minimum Wage Hikes
Production / Manufacturing / Quality Control ...
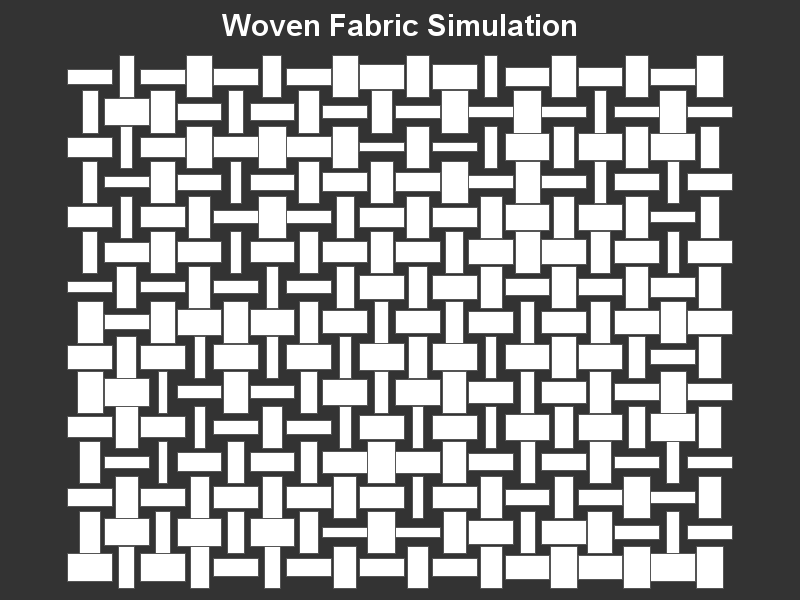
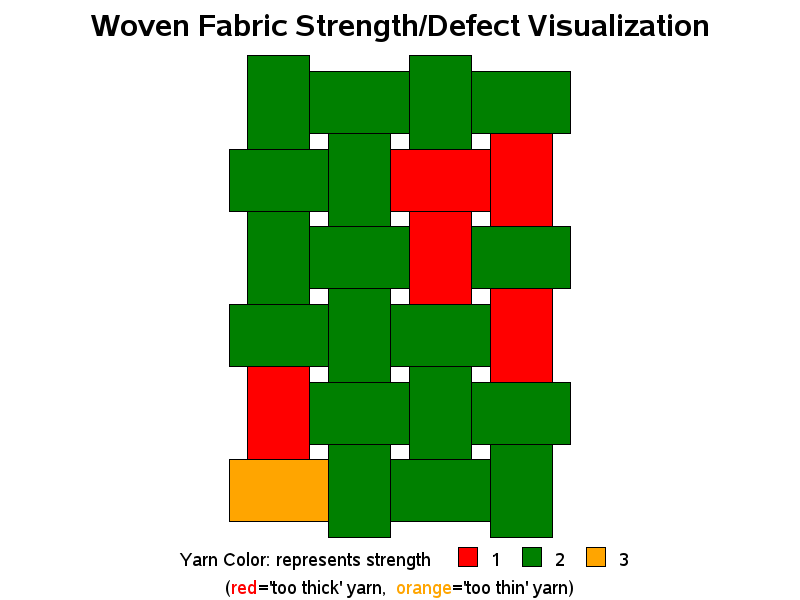
Woven Fabric Simulation
Woven Fabric Map
Defect Visualizaiton map
Cotton Quality
Warranty Analysis Plot
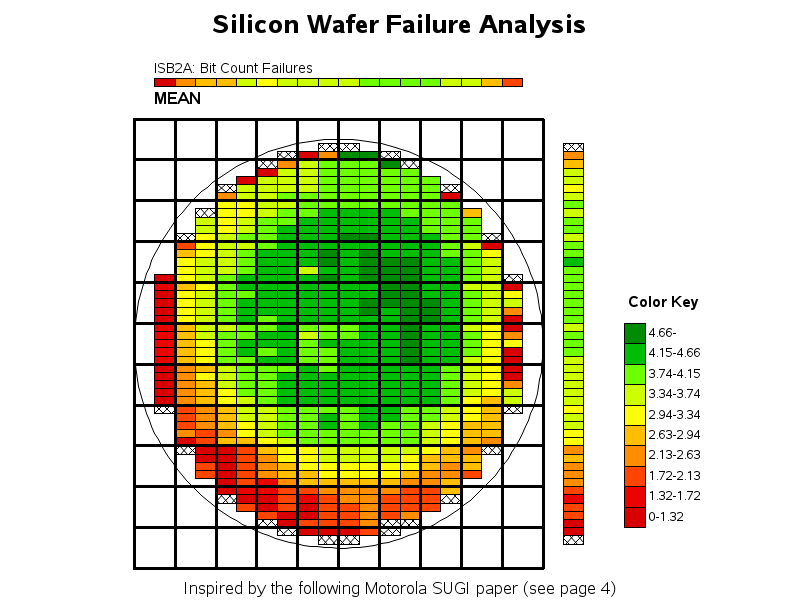
Defect Analysis Maps
Stations on Shop Floors
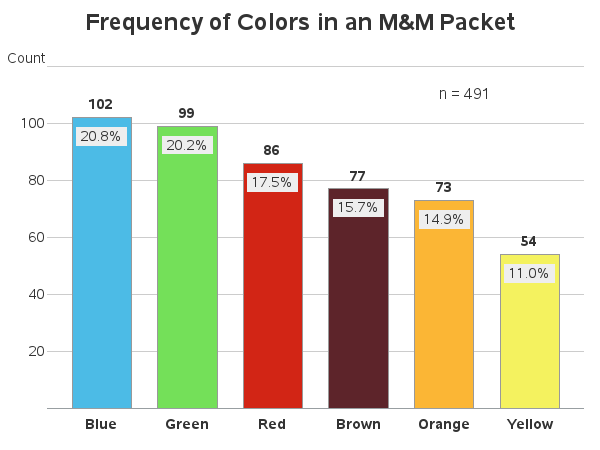
Q.C. for M&Ms
Pollution ...
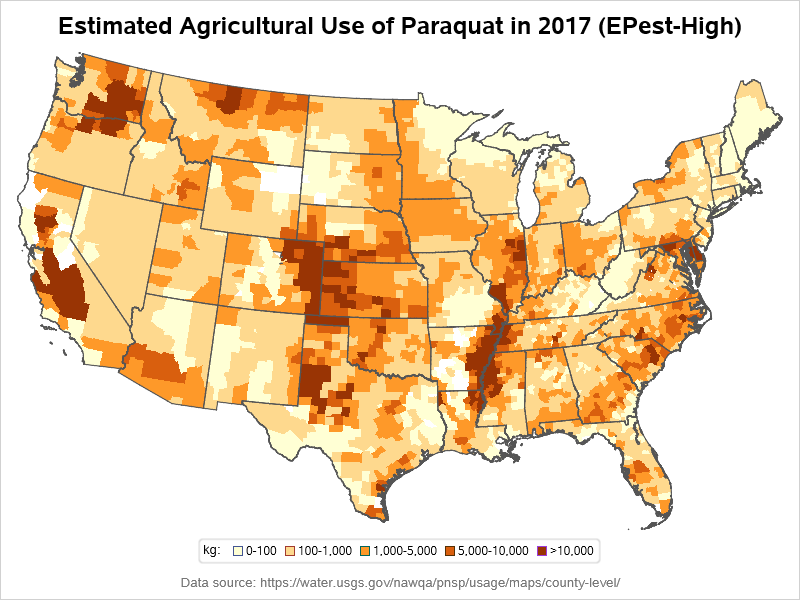
Paraquat Weed Killer
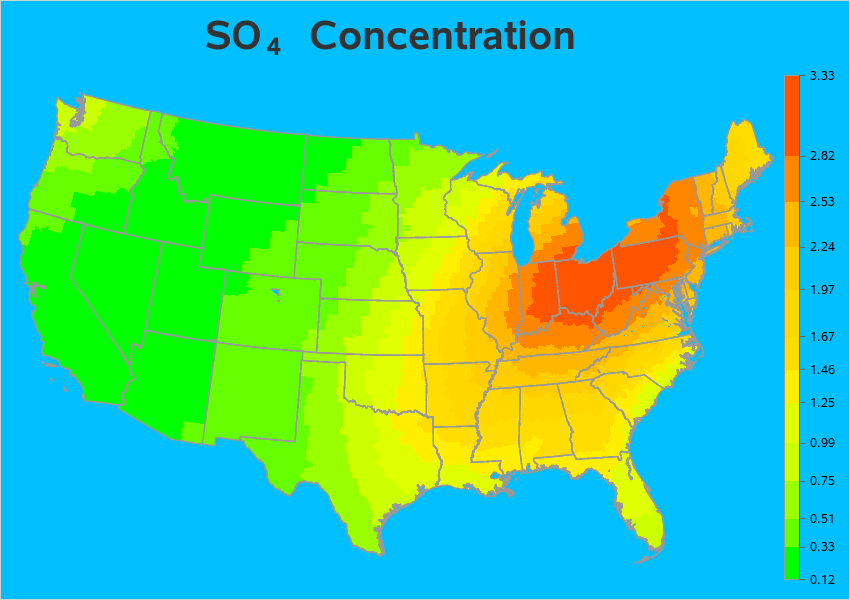
SO4 Concentration
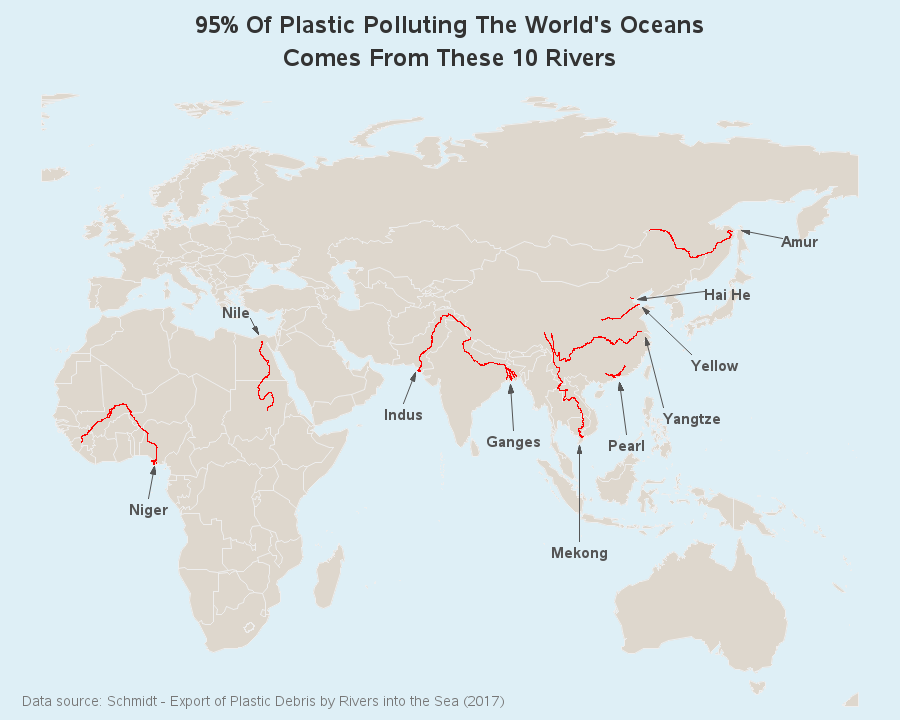
Plastic from Rivers
Wells near Ash Ponds
Mercury in ME Lakes
Lead Pollution Exposure
Groundwater Arsenic
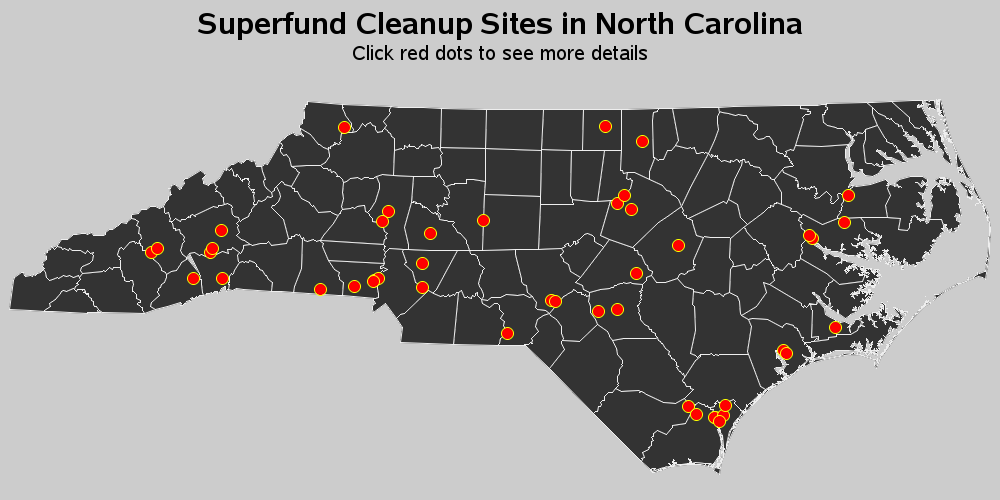
Superfund Cleanup
Sales & Marketing ...
Target Your Customers
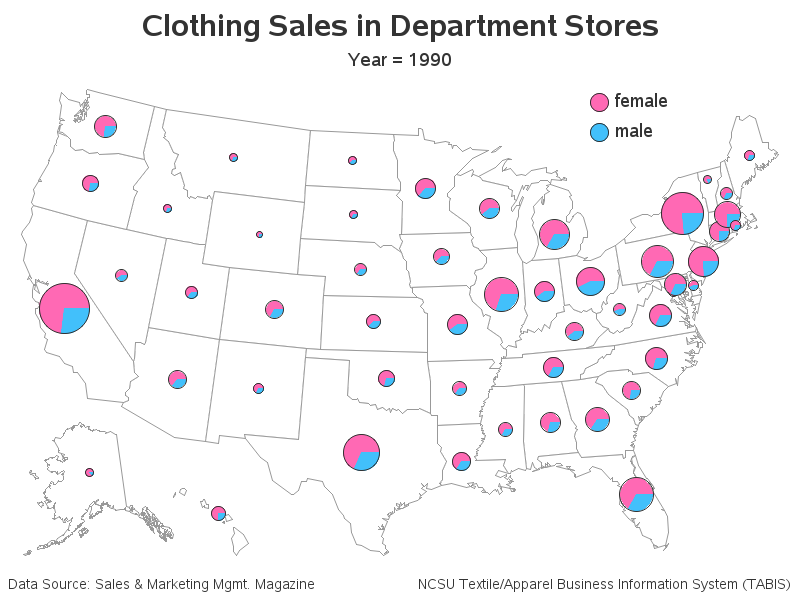
Clothing Sales by Sex
Shoe Sales Tree Map
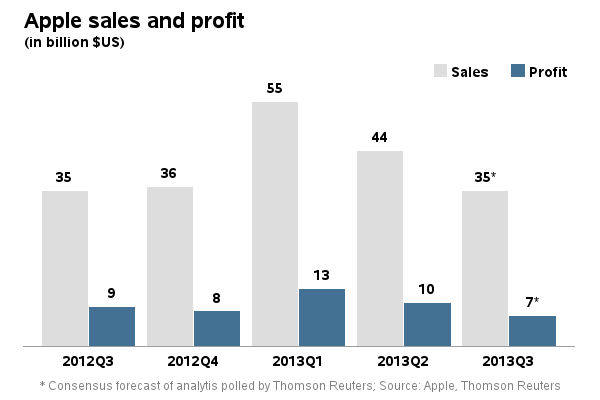
Apple Bad Quarter
Musikasa Dashboard
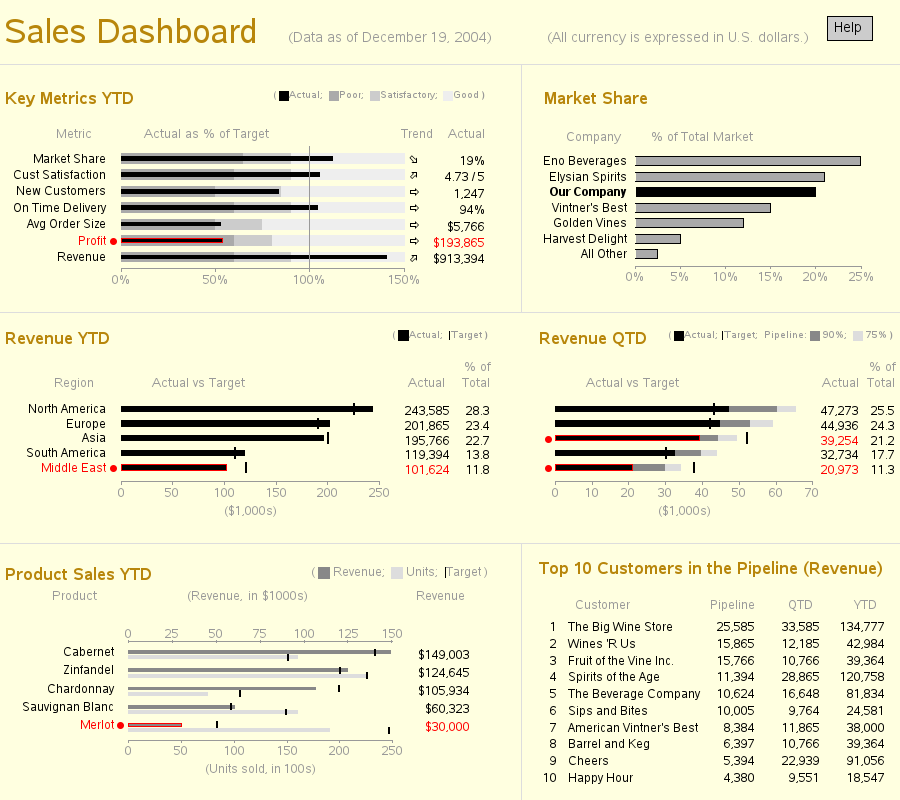
Stephen Few Dashboard
Track Web Marketing
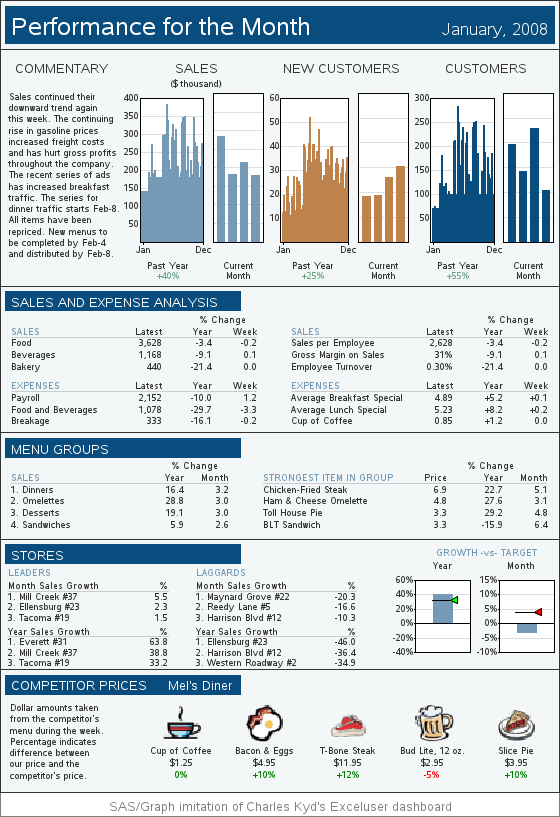
Restaurant Sales
Customer Preferences & Satisfaction ...
Customer Satisfaction
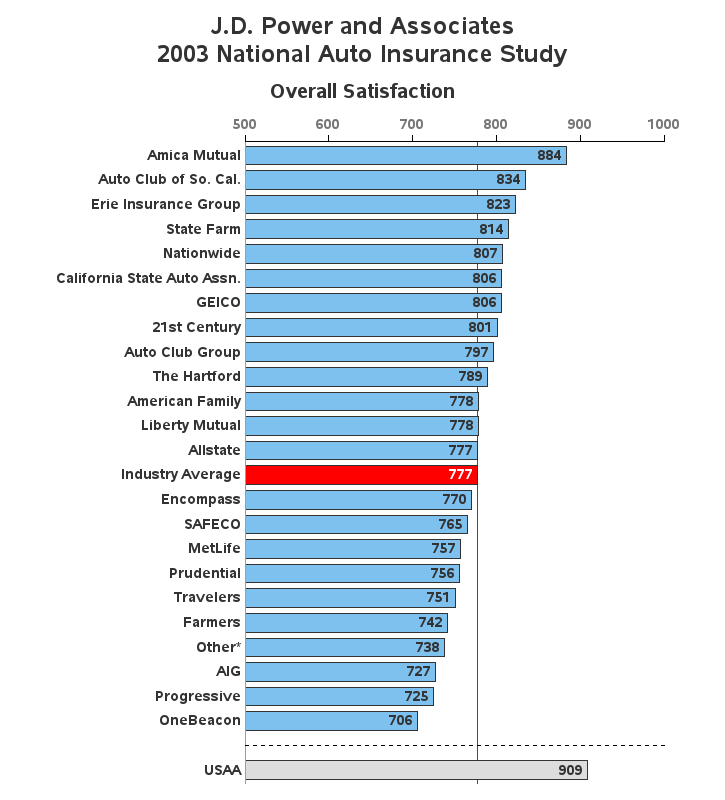
Satisfaction Comparison
Factors of Satisfaction
Social Media Likes
These samples courtesy of Robert Allison
Please see the following README

