SAS Examples & Ideas for Teachers
Click on thumbnail to see full-size chart.
Click on label to see explanation and SAS code.
Using 'Science Project' Data:
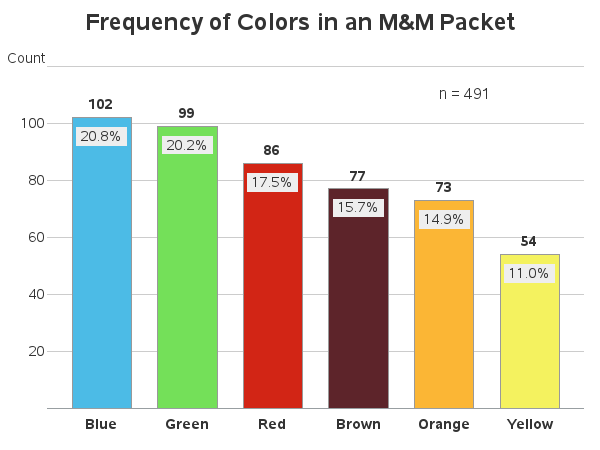
M&M Color Distribution
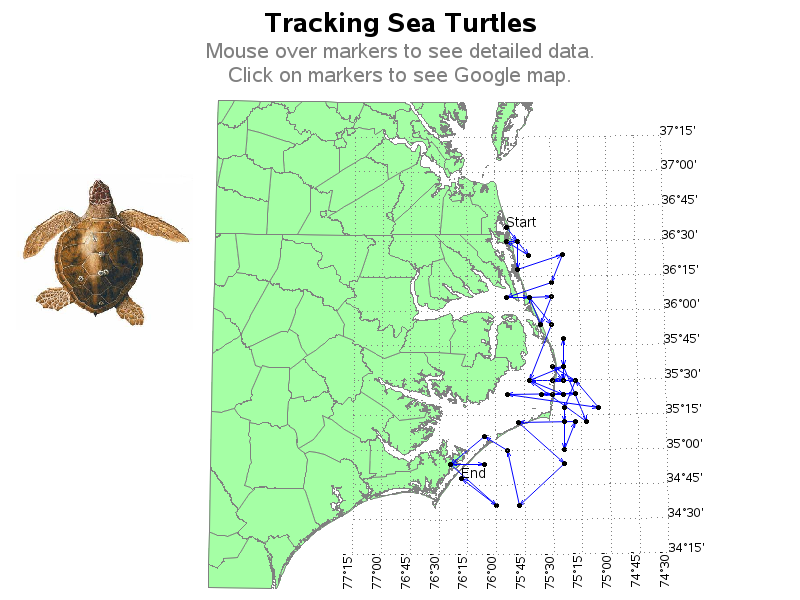
Track Sea Turtles
Local Interest Data:
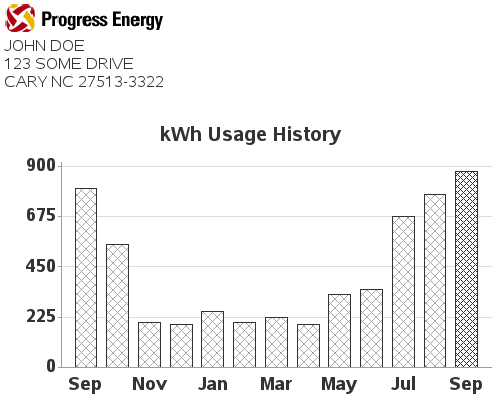
Power/Water Bill Data
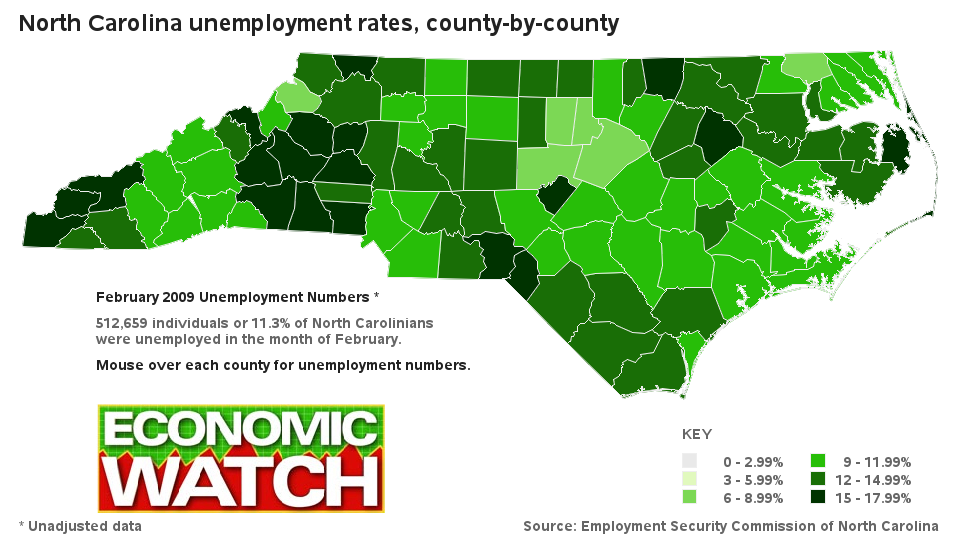
Unemployment Data
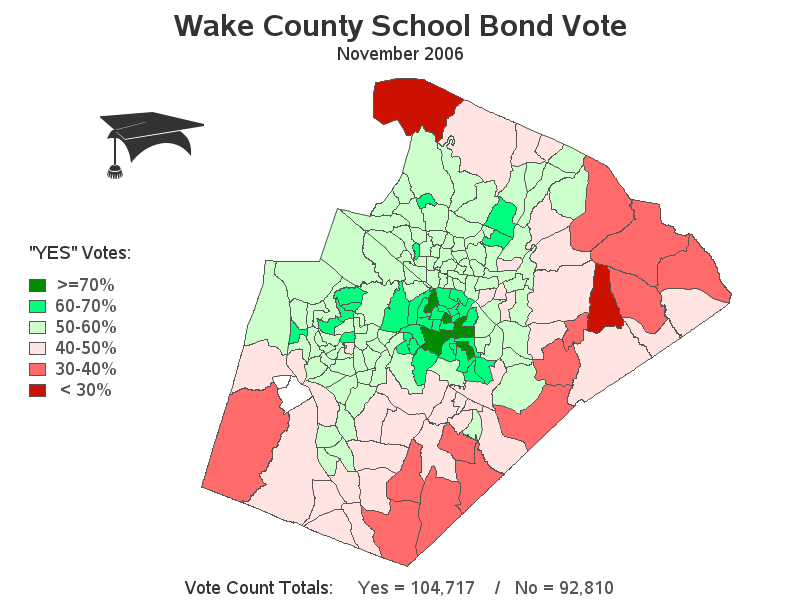
School Bond Voting
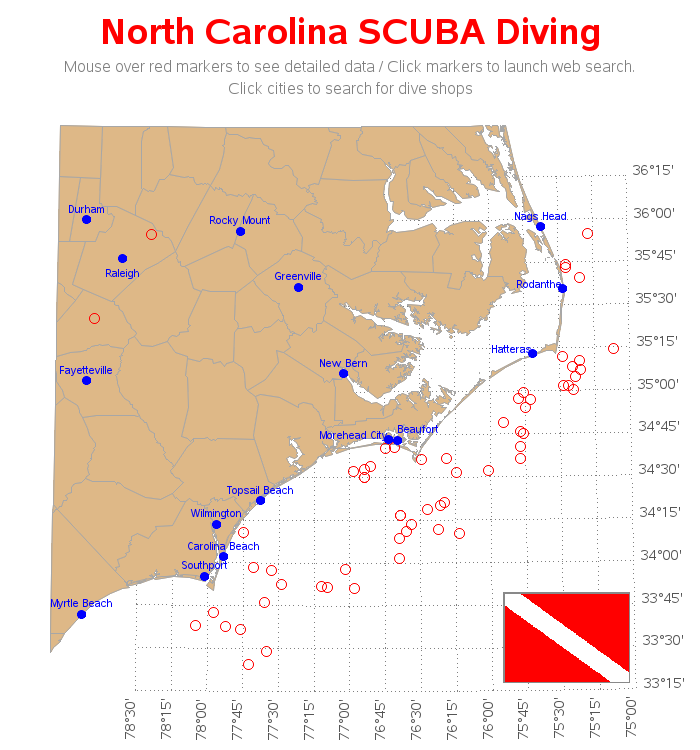
Shipwreck Locations
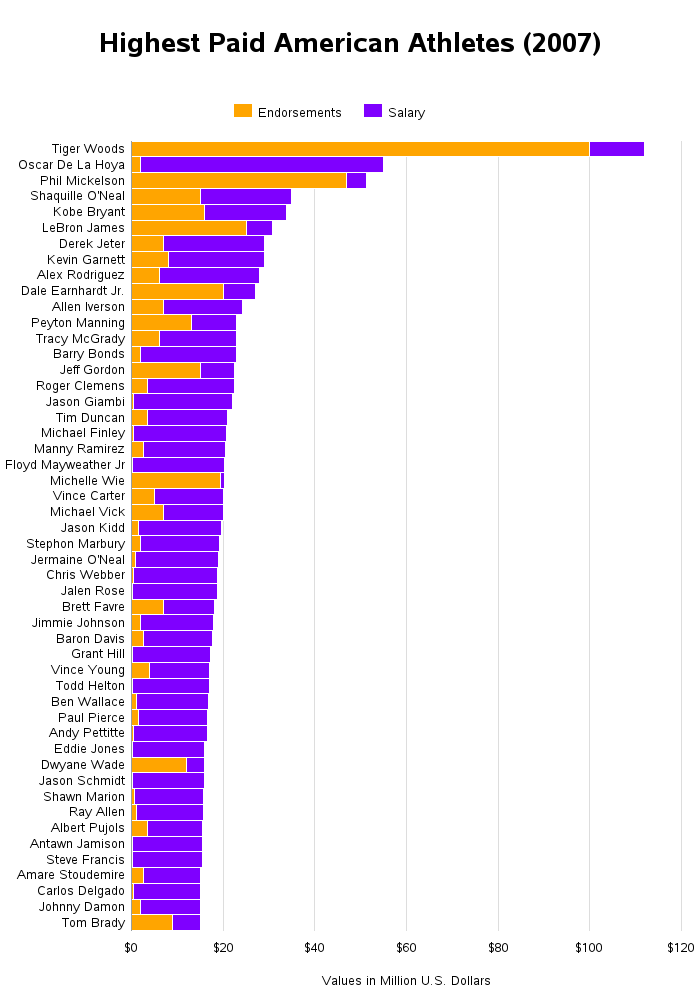
Highest Paid Pro Athletes
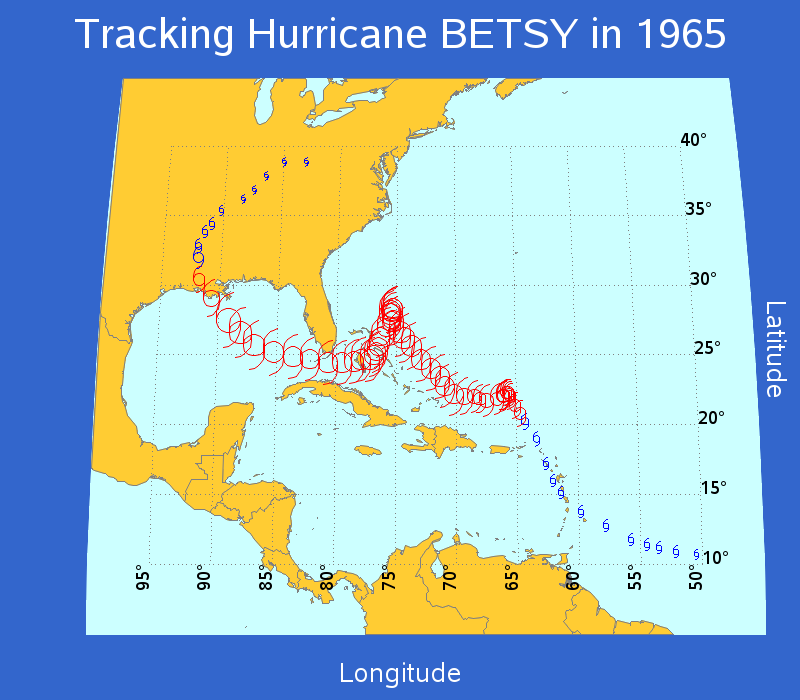
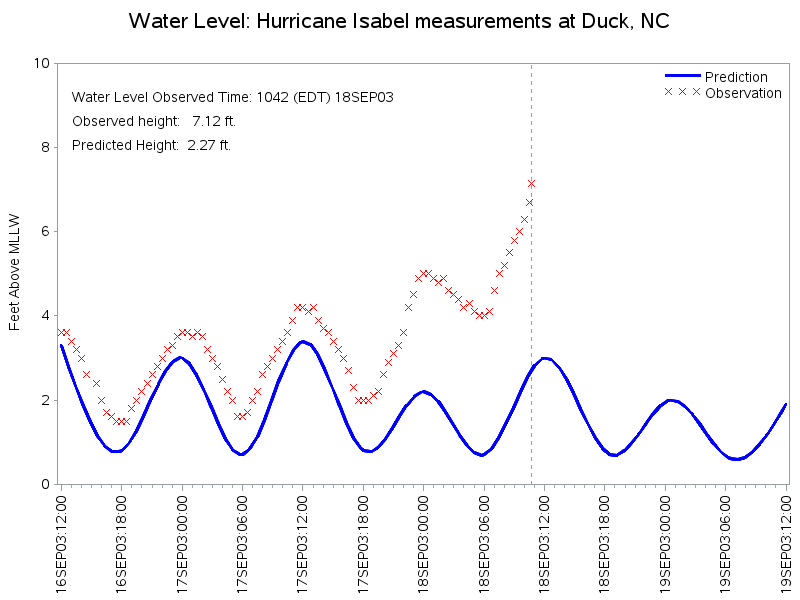
Track Storms/Hurricanes
Graph Raw Weather Data
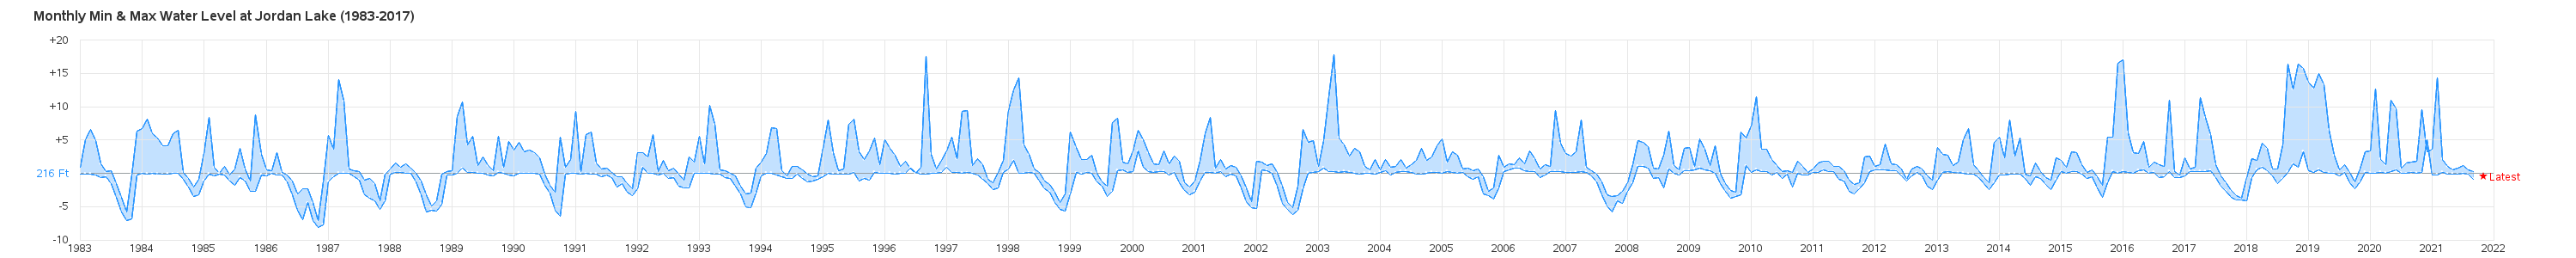
Drought / Lake Levels
National Interest Data:
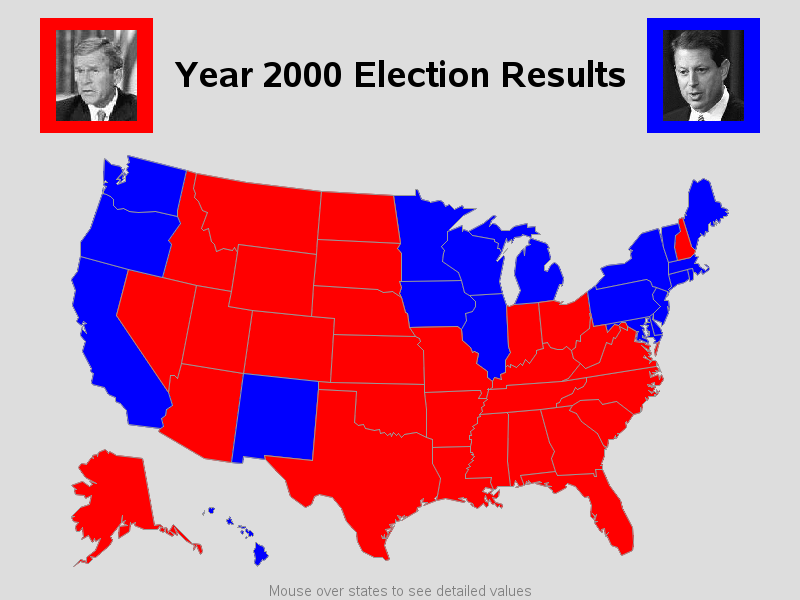
Presidential Election Results
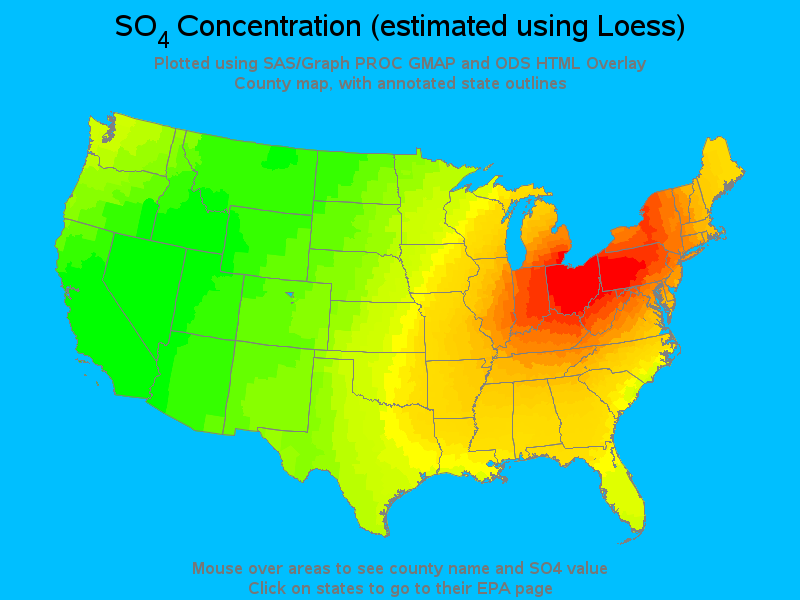
Pollution/Contamination
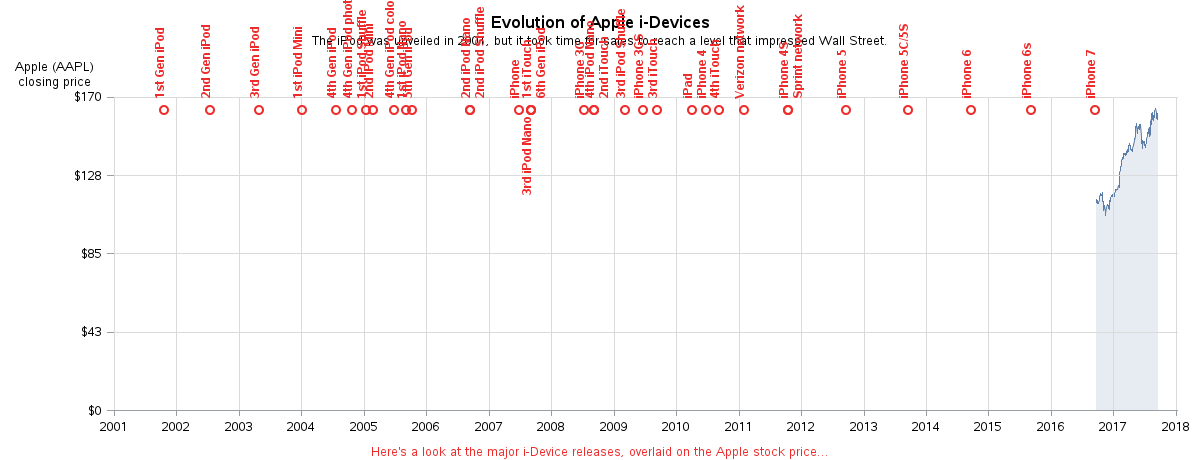
Tracking Stock Market
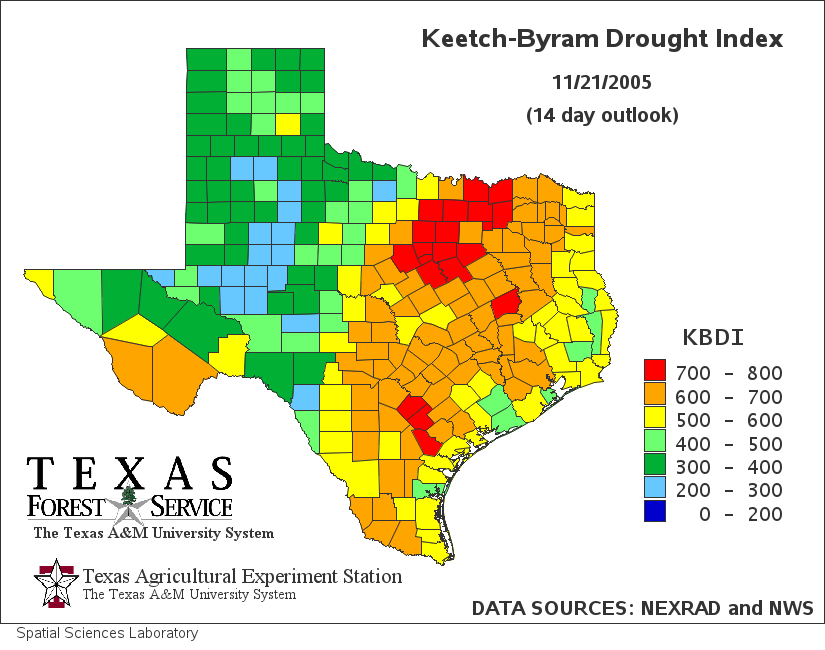
Mapping Drought Data
The Sky's The Limit!
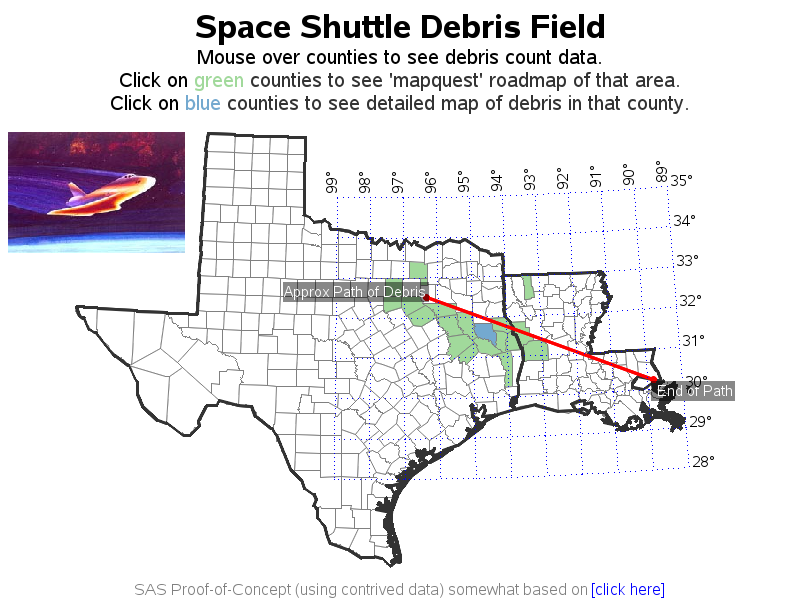
Track Space Shuttle Debris
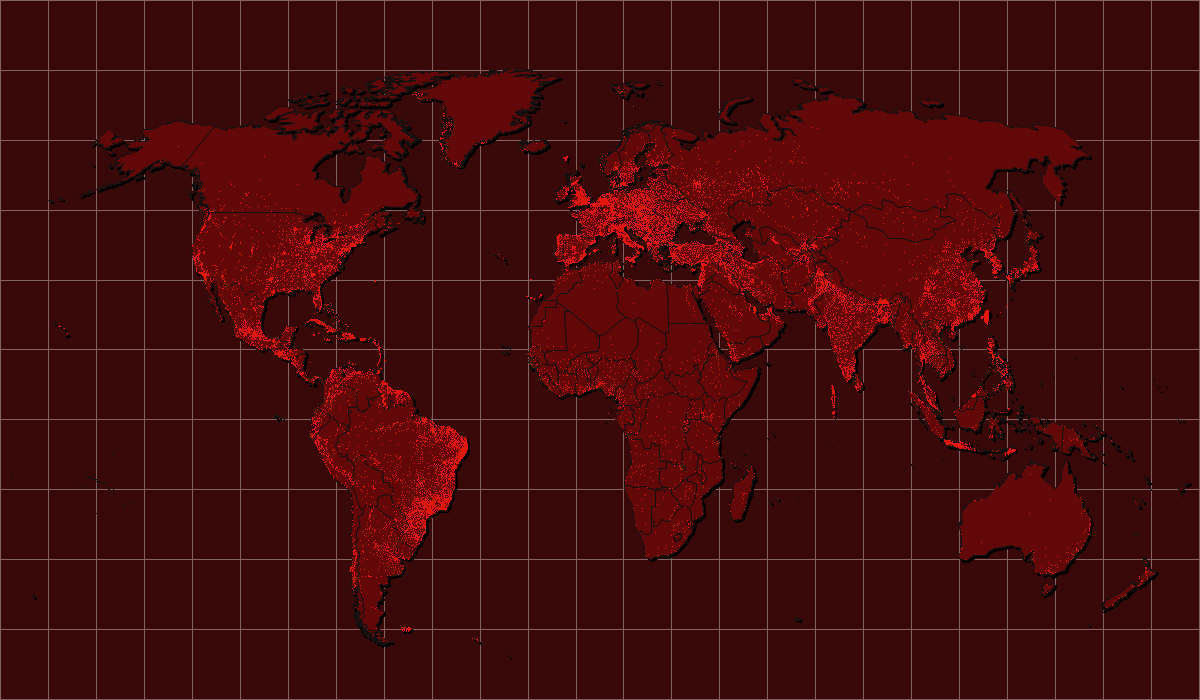
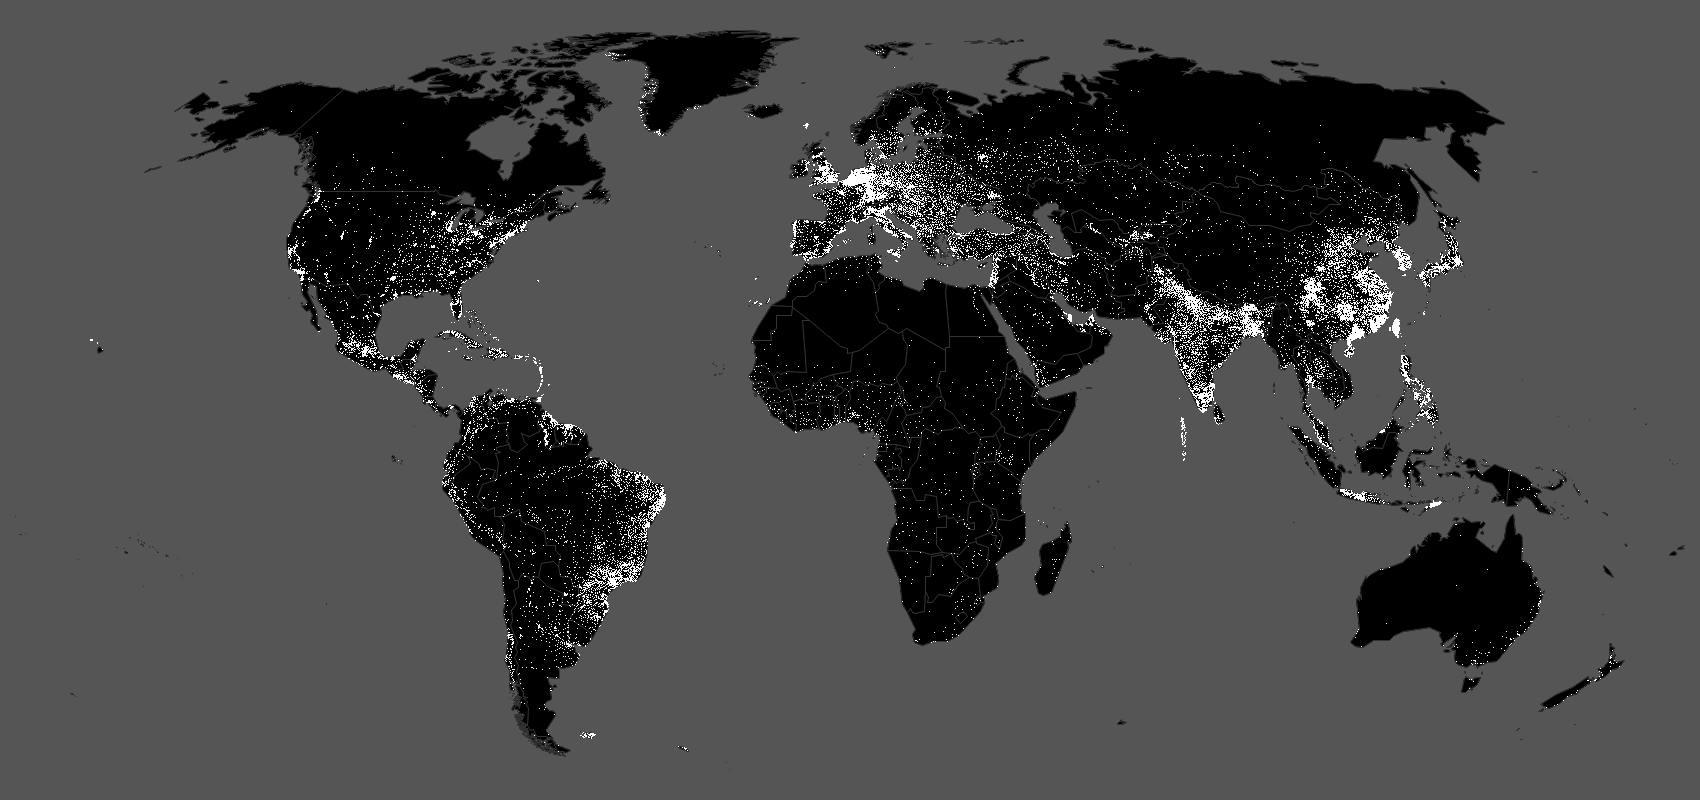
Worldwide Cities Map
Variation on World Cities
Security Breach Map
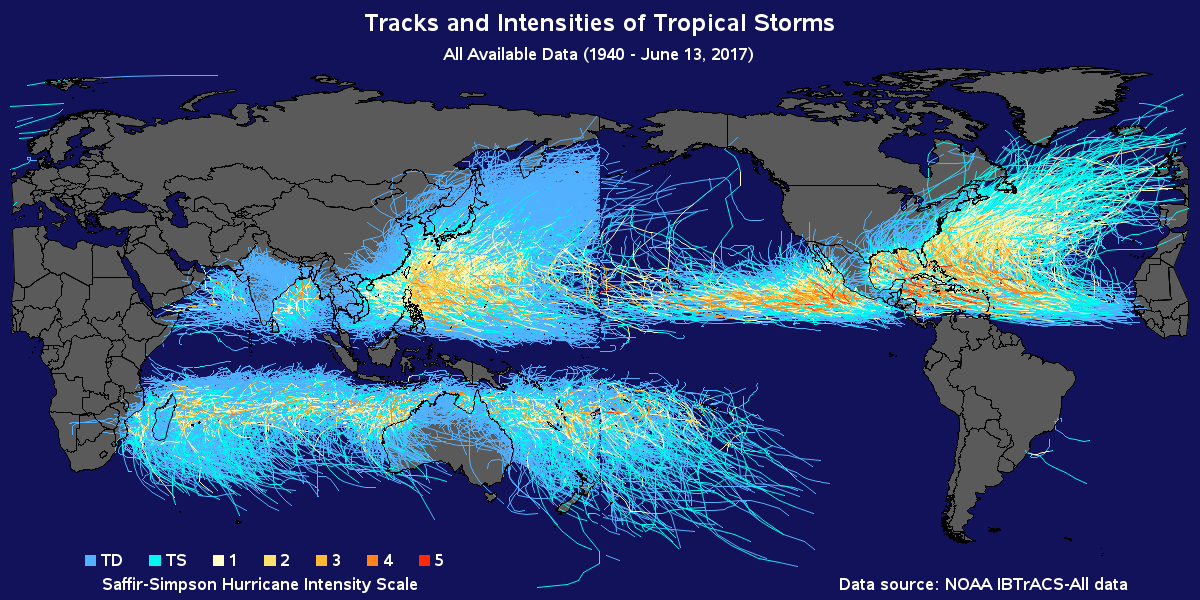
Hurricanes & Typhoon Map
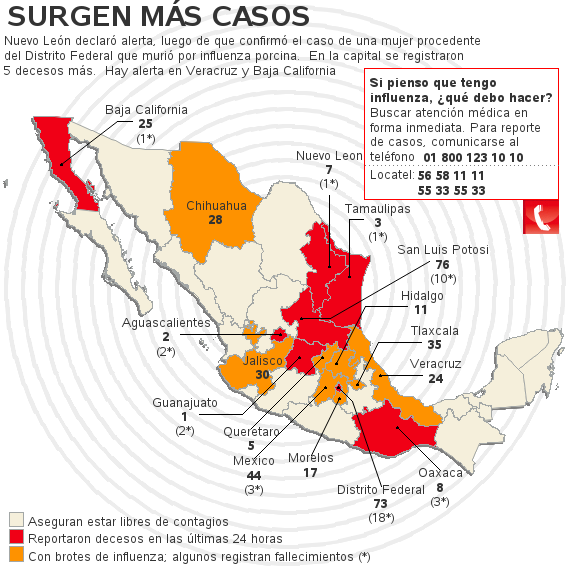
Tracking the Swine Flu
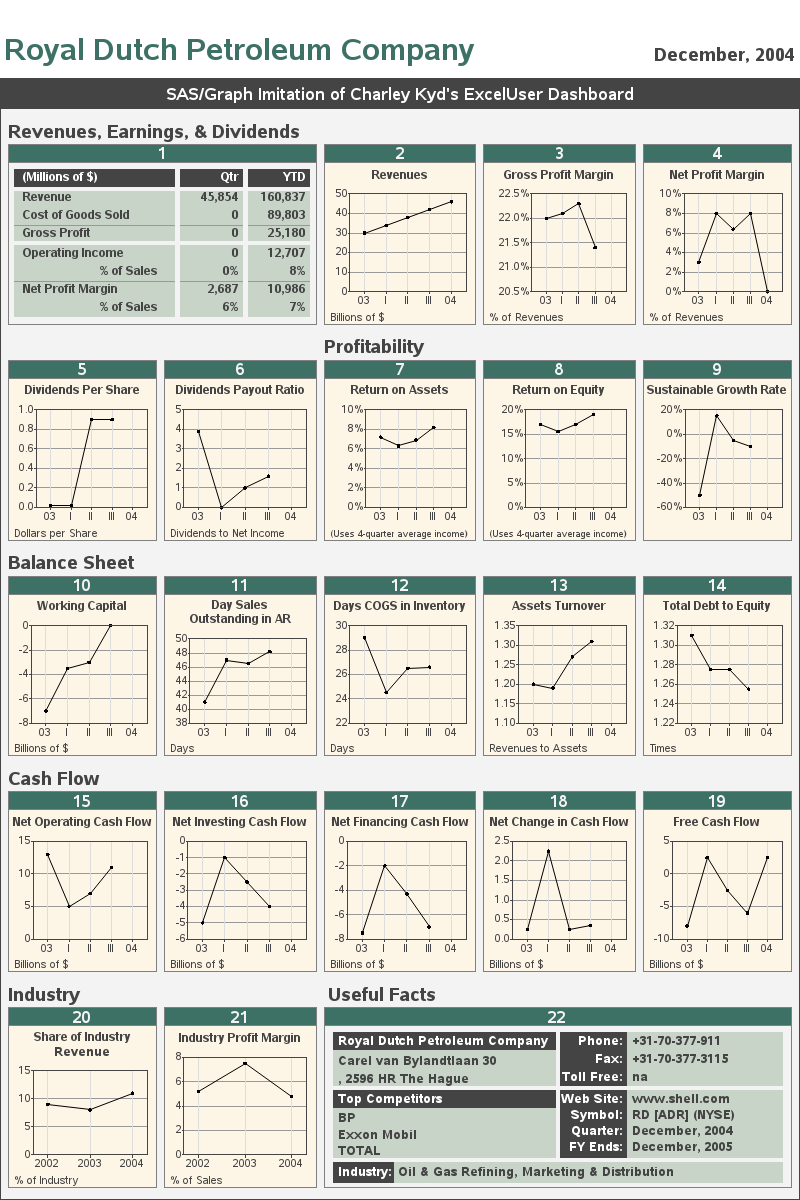
CEO Business Dashboard
Teacher Salary Data
These samples courtesy of Robert Allison
Please see the following README